 usdata
NOAA's Center for Operational Oceanographic Products and Services (CO-OPS) runs current meters in harbours and shipping channels, most of them part of its Physical Oceanographic Real-Time System (PORTS). An acoustic Doppler current profiler, mounted on the bottom or on a buoy, measures the water's velocity in a stack of cells, called bins, and the CO-OPS Data API serves six-minute speed and direction for one station and one bin as a CSV.
This walkthrough pulls one UTC day, 6 May 2025, at Cape Henry LB 2CH
(cb0102) at the mouth of Chesapeake Bay, bin 4. It needs usdata[pandas]
and matplotlib, and downloads one 7 kB file in a second or two.
from datetime import UTC, datetime
from pathlib import Path

import matplotlib.dates as mdates
import matplotlib.pyplot as plt
import numpy as np
import pandas as pd

import usdata
from usdata import cite_lockfile, pull, verify

# One figure style for every usdata notebook, so previews look alike.
plt.rcParams.update(
    {
        "figure.figsize": (8, 4.5),
        "figure.dpi": 120,
        "axes.spines.top": False,
        "axes.spines.right": False,
        "axes.grid": True,
        "grid.alpha": 0.3,
        "font.size": 10,
    }
)
manifest = Path("dataset.yaml")
print("Executed (UTC):", datetime.now(UTC).isoformat(timespec="seconds"))
print(f"usdata {usdata.__version__}; pandas {pd.__version__}")
Executed (UTC): 2026-09-24T05:59:50+00:00
usdata 0.26.0; pandas 3.0.6
Select
The manifest names one station, one bin, the units, and a window. Station IDs
are alphanumeric (cb0102); keep NOAA's spelling. The bin is required, even
where NOAA would pick a default, so the selection is explicit in the request
and its provenance. units: metric means centimetres per second, not metres
per second; english gives knots.
Both bounds are UTC and inclusive, and a bare date as the end means 23:59 on that day, so start and end on 6 May select that whole day. One source covers at most 28 days.
print(manifest.read_text())name: cape-henry-currents
sources:
- name: currents
dataset: noaa:coops-currents
start: 2025-05-06
end: 2025-05-06
params:
station: cb0102
bin: 4
units: metric
What arrives
The first pull downloads one CSV and writes dataset.lock.json beside the
manifest, pinning the file's checksum. The source URL records the station,
bin, units, and time zone; the CSV itself names only the bin.
result = pull(manifest)
item = result.one("currents")
print("File:", item.path.name)
print("Bytes:", item.provenance.size)
print("Source:", item.provenance.source_url)
print("Retrieved (UTC):", item.provenance.retrieved_at.isoformat(timespec="seconds"))
print("Checksum:", item.provenance.checksum)
File: currents_cb0102_4197b68057a874d0.csv
Bytes: 6659
Source: https://api.tidesandcurrents.noaa.gov/api/prod/datagetter?station=cb0102&product=currents&begin_date=20250506+00%3A00&end_date=20250506+23%3A59&bin=4&units=metric&time_zone=gmt&format=csv&application=usdata
Retrieved (UTC): 2026-09-24T05:59:51+00:00
Checksum: sha256:418f89fee24651e1267b67bd3c1eadd8cbb85f59652417577b16a54e31538f08
Open
The generic CSV reader returns four columns, with NOAA's leading spaces in the
names; strip them locally. Date Time is text in UTC with no offset, Speed
is cm/s, and Direction is degrees clockwise from true north toward which the
water flows, as NOAA's glossary
defines it. Bin repeats the request. There is no depth column and no
preliminary or verified quality field; the absence of a flag is not a claim
that the data were verified.
The six-minute records at this station fall two minutes after each
six-minute mark (00:02, 00:08, ...). The cell below checks that every row shares
that grid before counting the slots with no row, and leaves those gaps
unfilled.
frame = item.open().rename(columns=str.strip)
frame["Date Time"] = pd.to_datetime(frame["Date Time"], utc=True)
frame = frame.set_index("Date Time")
assert frame["Bin"].eq(4).all() and not frame.index.duplicated().any()
day = pd.Timestamp("2025-05-06", tz="UTC")
phase = (frame.index[0] - day) % pd.Timedelta(minutes=6)
assert ((frame.index - day) % pd.Timedelta(minutes=6) == phase).all()
grid = pd.date_range(day + phase, day + pd.Timedelta(days=1), freq="6min", inclusive="left")
missing = grid.difference(frame.index)
print(f"{len(frame)} rows of {len(grid)} six-minute slots")
print("Missing slots (UTC):", ", ".join(f"{t:%H:%M}" for t in missing) or "none")
print("Blank values:", frame[["Speed", "Direction"]].isna().sum().to_dict())
frame.head()
239 rows of 240 six-minute slots
Missing slots (UTC): 19:32
Blank values: {'Speed': 0, 'Direction': 0}
| Speed | Direction | Bin | |
|---|---|---|---|
| Date Time | |||
| 2025-05-06 00:02:00+00:00 | 17.3 | 285 | 4 |
| 2025-05-06 00:08:00+00:00 | 18.5 | 286 | 4 |
| 2025-05-06 00:14:00+00:00 | 15.9 | 280 | 4 |
| 2025-05-06 00:20:00+00:00 | 13.3 | 301 | 4 |
| 2025-05-06 00:26:00+00:00 | 15.1 | 282 | 4 |
Bin 4 is a cell of water, not a fixed depth. NOAA's metadata service, read on 2026-09-22, places bin 4 of the deployment that began on 27 January 2025 at 6.52 m below the surface, with a downward-looking instrument and a flood direction of 280°. Bin depths can change from one deployment to the next, so the exact responses are kept in a dated metadata snapshot rather than assumed.
Directions fall in two groups, one on either side of that flood direction:
sectors = pd.cut(frame["Direction"], bins=range(0, 361, 45), right=False)
print(sectors.value_counts(sort=False).rename("rows").to_string())
Direction
[0, 45) 1
[45, 90) 20
[90, 135) 71
[135, 180) 22
[180, 225) 7
[225, 270) 26
[270, 315) 86
[315, 360) 6
A first look
Speed and direction together make one velocity. Projecting it onto NOAA's flood direction for this deployment gives the along-channel current: positive while water flows into the bay (flood, toward 280°), negative while it flows out (ebb, toward 100°). Missing slots stay as gaps.
FLOOD = 280  # degrees true, from NOAA's deployment metadata for cb0102
series = frame.reindex(grid)
along = series["Speed"] * np.cos(np.radians(series["Direction"] - FLOOD))
fig, ax = plt.subplots(layout="constrained")
ax.plot(along.index, along, color="#2563a6", linewidth=1.5)
ax.fill_between(along.index, along, 0, where=along > 0, color="#2563a6", alpha=0.2, label="Flood")
ax.fill_between(along.index, along, 0, where=along < 0, color="#b45631", alpha=0.2, label="Ebb")
ax.axhline(0, color="black", linewidth=1)
ax.xaxis.set_major_locator(mdates.HourLocator(byhour=range(0, 24, 3)))
ax.xaxis.set_major_formatter(mdates.DateFormatter("%H:%M", tz=UTC))
ax.set_xlim(day, day + pd.Timedelta(days=1))
ax.set_xlabel("6 May 2025 (UTC)")
ax.set_ylabel("Along-channel current (cm/s)\nflood toward 280° positive")
ax.set_title("Cape Henry LB 2CH, Chesapeake Bay mouth, bin 4: observed current")
ax.legend(loc="lower left", frameon=False)
plt.show()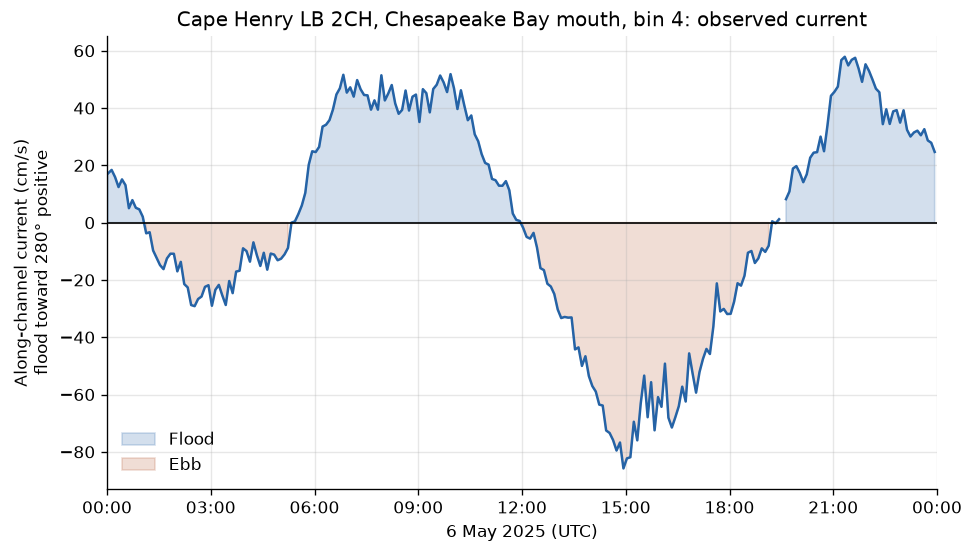
direction = frame["Direction"]
flooding = ((direction - FLOOD + 180) % 360 - 180).abs() < 90
phases = (flooding != flooding.shift()).cumsum()
runs = frame.groupby(phases).agg(
    start=("Speed", lambda s: s.index[0]),
    end=("Speed", lambda s: s.index[-1]),
    peak_speed=("Speed", "max"),
    peak_at=("Speed", "idxmax"),
)
runs.insert(0, "phase", flooding.groupby(phases).first().map({True: "flood", False: "ebb"}))
runs = runs[runs["end"] - runs["start"] >= pd.Timedelta("1h")]
for column in ["start", "end", "peak_at"]:
    runs[column] = runs[column].dt.strftime("%H:%M")
print(runs.to_string(index=False))
phase start end peak_speed peak_at
flood 00:02 01:02 18.5 00:08
ebb 01:08 05:20 30.2 02:38
flood 05:26 11:56 56.9 07:14
ebb 12:02 19:08 85.8 14:56
flood 19:26 23:56 58.1 21:38
The current reversed four times in the day, as the tide at the bay mouth rose and fell twice, and the two ebbs were far from equal: the early one peaked at 30.2 cm/s, the afternoon one at 85.8 cm/s at 14:56 UTC, while both full floods peaked near 57 to 58 cm/s. Around 19:14 and 19:20 the direction flickered between the two groups at slack water, when speed is near its minimum and direction means least; the one missing slot, 19:32, is the gap just after.
Pin and cite
verify checks the cached file against the lockfile's checksum. Keep the
manifest, lockfile, and metadata snapshot with your analysis. CO-OPS may
revise query responses later; a successful verify shows the bytes match
what was pinned. The citation below is what a methods section needs, and
usdata cite dataset.yaml prints the same.
assert verify(manifest) == []
for citation in cite_lockfile(manifest):
    print(citation.as_text())
noaa:coops-currents
NOAA National Ocean Service, CO-OPS observed currents, accessed via usdata
homepage: https://api.tidesandcurrents.noaa.gov/api/prod/
license: US Government Work (public domain)
terms: https://tidesandcurrents.noaa.gov/disclaimers.html
retrieved: 2026-09-24; 1 checksummed asset (6,659 bytes) pinned by usdata 0.26.0
sources: currents
What was awkward
- The CSV carries a bin number but no depth. Depth needs dated station metadata from a second NOAA service, and even then it describes the current deployment, not necessarily the historical day.
- Metric speed is cm/s, not m/s, and the CSV header does not say so; the manifest and source URL are the only record of the units.
- The six-minute records here fall two minutes after each six-minute mark, and one slot (19:32) is missing. The grid has to be checked before gaps are counted.
- Direction is circular. Averaging or connecting angles across 0° and 360° misleads, and the flood direction that turns speed and direction into a signed current comes from the metadata service, not the data.
- The basic response has no quality flag, so nothing says whether a value is preliminary or verified.
- NOAA's documentation mentions hourly currents in one place and says only
six-minute data exist in another; a probe found
interval=hignored, so usdata requests only the native interval.