 usdata
NOAA's Global Summary of the Year (GSOY) condenses each land station's daily GHCN-Daily record into one row per calendar year: annual precipitation, mean temperature, extremes, and counts of days past thresholds. NCEI publishes it through its Access Data Service, and one request returns one CSV with a row per station and year.
This walkthrough pulls thirty years of precipitation and mean temperature at
Will Rogers World Airport in Oklahoma City, 1995 to 2024. It needs
usdata[pandas] and matplotlib, and runs in a few seconds.
from datetime import UTC, datetime
from pathlib import Path

import matplotlib.pyplot as plt
import pandas as pd

import usdata
from usdata import cite_lockfile, pull, verify

# One figure style for every usdata notebook, so previews look alike.
plt.rcParams.update(
    {
        "figure.figsize": (8, 4.5),
        "figure.dpi": 120,
        "axes.spines.top": False,
        "axes.spines.right": False,
        "axes.grid": True,
        "grid.alpha": 0.3,
        "font.size": 10,
    }
)
manifest = Path("dataset.yaml")
print("Executed (UTC):", datetime.now(UTC).isoformat(timespec="seconds"))
print(f"usdata {usdata.__version__}; pandas {pd.__version__}")
Executed (UTC): 2026-09-24T05:46:28+00:00
usdata 0.26.0; pandas 3.0.6
Select
The manifest names one station, two variables, and a window. GSOY selects
every UTC calendar year the window touches, in full: 6 May 2024 alone would
select all of 2024, and 31 December to 1 January selects both years.
units: metric asks for millimetres and degrees Celsius.
print(manifest.read_text())name: okc-annual-climate
sources:
- dataset: noaa:gsoy
start: 1995-01-01
end: 2024-12-31
variables: [PRCP, TAVG]
params:
stations: USW00013967
units: metric
What arrives
The first pull downloads one CSV and writes dataset.lock.json beside the
manifest, pinning the file's checksum. Later pulls reuse the pin and the cache.
result = pull(manifest)
(item,) = result.fetched
print("File:", item.path.name)
print("Bytes:", item.provenance.size)
print("Source:", item.provenance.source_url)
print("Retrieved (UTC):", item.provenance.retrieved_at.isoformat(timespec="seconds"))
print("Checksum:", item.provenance.checksum)
File: global-summary-of-the-year_1995-01-01_2024-12-31_03f41df5d7f1.csv
Bytes: 2081
Source: https://www.ncei.noaa.gov/access/services/data/v1?dataset=global-summary-of-the-year&stations=USW00013967&startDate=1995-01-01&endDate=2024-12-31&format=csv&units=metric&includeStationLocation=1&dataTypes=PRCP%2CTAVG
Retrieved (UTC): 2026-09-24T05:46:29+00:00
Checksum: sha256:2126a4daf23ff145cc4cb6703d65c676c0664222bce63ee9673f2d203ea82cfd
Open
The generic CSV reader returns a DataFrame. DATE is a four-digit year label;
reading it as text keeps it a label rather than a number. PRCP is the annual
total in millimetres and TAVG the annual mean in degrees Celsius. NCEI's CSV
has no units row, so the units come from the request.
frame = item.open_csv(dtype={"DATE": "string"})
frame["YEAR"] = frame["DATE"].astype(int)
print(f"{len(frame)} rows, {frame['YEAR'].min()} to {frame['YEAR'].max()}")
frame[["STATION", "DATE", "PRCP", "TAVG"]].tail()
30 rows, 1995 to 2024
| STATION | DATE | PRCP | TAVG | |
|---|---|---|---|---|
| 25 | USW00013967 | 2020 | 979.8 | 15.8 |
| 26 | USW00013967 | 2021 | 803.2 | 15.9 |
| 27 | USW00013967 | 2022 | 667.9 | 16.1 |
| 28 | USW00013967 | 2023 | 947.9 | 16.7 |
| 29 | USW00013967 | 2024 | 942.4 | 17.4 |
A first look
Thirty annual totals and means, with the thirty-year average of each drawn across.
fig, (wet, warm) = plt.subplots(2, 1, sharex=True, layout="constrained")
wet.bar(frame["YEAR"], frame["PRCP"], color="#2563a6")
wet.axhline(frame["PRCP"].mean(), color="black", linewidth=1)
wet.set_ylabel("Precipitation (mm)")
wet.set_title("Will Rogers World Airport, Oklahoma City: annual summaries")
warm.plot(frame["YEAR"], frame["TAVG"], marker="o", color="#b45631")
warm.axhline(frame["TAVG"].mean(), color="black", linewidth=1)
warm.set_ylabel("Mean temperature (°C)")
plt.show()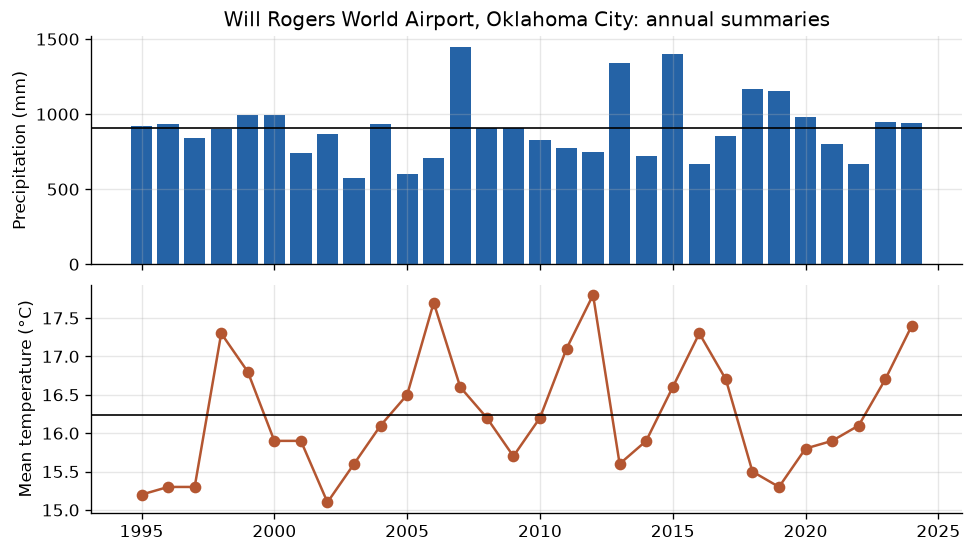
wettest = frame.loc[frame["PRCP"].idxmax()]
driest = frame.loc[frame["PRCP"].idxmin()]
print(f"Wettest: {wettest['DATE']} with {wettest['PRCP']:.0f} mm")
print(f"Driest: {driest['DATE']} with {driest['PRCP']:.0f} mm")
print(f"Mean temperature ranged {frame['TAVG'].min():.1f} to {frame['TAVG'].max():.1f} °C")
Wettest: 2007 with 1447 mm
Driest: 2003 with 575 mm
Mean temperature ranged 15.1 to 17.8 °C
Year-to-year precipitation varies far more than mean temperature. One station's thirty years describe that airport's record, not a regional trend.
Pin and cite
verify checks the cached file against the lockfile's checksum. Keep the
manifest and lockfile with your analysis; the citation below is what a
methods section needs, and usdata cite dataset.yaml prints the same.
assert verify(manifest) == []
for citation in cite_lockfile(manifest):
    print(citation.as_text())
noaa:gsoy
Lawrimore, Jay H.; Ray, Ron; Applequist, Scott; Korzeniewski, Bryant; Menne, Matthew J. (2016): Global Summary of the Year (GSOY), Version 1. NOAA National Centers for Environmental Information. https://doi.org/10.7289/JWPF-Y430
homepage: https://www.ncei.noaa.gov/access/search/data-search/global-summary-of-the-year
license: US Government Work (public domain)
terms: https://www.ncei.noaa.gov/metadata/geoportal/rest/metadata/item/gov.noaa.ncdc:C00947/html
retrieved: 2026-09-24; 1 checksummed asset (2,081 bytes) pinned by usdata 0.26.0
sources: 1
What was awkward
DATElooks like a number, so pandas reads it as one unless told otherwise;dtype={"DATE": "string"}keeps the year a label.- The CSV carries no units. The request's
units: metricis the only record of whetherPRCPis millimetres or inches, so the manifest has to travel with the data. - Annual labels hide different accumulation seasons for some elements; the GSOY guide says which.