 usdata
The International Best Track Archive for Climate Stewardship (IBTrACS) merges the best tracks of every agency that tracks tropical cyclones, from the U.S. National Hurricane Center and Joint Typhoon Warning Center to Tokyo, New Delhi, Réunion, and the Southern Hemisphere centres, into one global record since 1842. NOAA's National Centers for Environmental Information (NCEI) publishes it as whole files, each one subset of the record as a CSV or NetCDF file, and rebuilds them in place as agencies deliver tracks.
This walkthrough pulls the last3years CSV, every basin's storms for the
current season and the three before it, and maps the storms that reached
category 4 or 5. It needs usdata[pandas] and matplotlib (the NetCDF
format needs usdata[netcdf] instead), and downloads one 10 MB file in a
few seconds.
from datetime import UTC, datetime
from pathlib import Path

import matplotlib.pyplot as plt
import numpy as np
import pandas as pd

import usdata
from usdata import cite_lockfile, pull, verify

# One figure style for every usdata notebook, so previews look alike.
plt.rcParams.update(
    {
        "figure.figsize": (8, 4.5),
        "figure.dpi": 120,
        "axes.spines.top": False,
        "axes.spines.right": False,
        "axes.grid": True,
        "grid.alpha": 0.3,
        "font.size": 10,
    }
)
manifest = Path("dataset.yaml")
print("Executed (UTC):", datetime.now(UTC).isoformat(timespec="seconds"))
print(f"usdata {usdata.__version__}; pandas {pd.__version__}")
Executed (UTC): 2026-09-24T06:11:30+00:00
usdata 0.26.0; pandas 3.0.6
Select
IBTrACS has no query interface, so the manifest names one of the eleven files
NCEI builds and nothing else: all, since1980, last3years, active, or
one of seven basins. Dates, places, and variables are rejected rather than
ignored. format defaults to csv, and version could pin a product
version; without it the newest (v04r01) is used.
last3years moves with the calendar: it always holds the current season and
the three before it.
print(manifest.read_text())name: recent-global-tracks
sources:
- name: tracks
dataset: noaa:ibtracs
# One whole file: the last three seasons and the current one, every basin.
# IBTrACS has no query interface, so dates and geographic filters are
# rejected; filter the parsed table locally. The file is rebuilt in place
# as agencies deliver best tracks, so the lockfile's checksum is the pin.
params:
subset: last3years
What arrives
The first pull downloads one CSV and writes dataset.lock.json beside the
manifest, pinning its checksum. The filename never changes, but NCEI rebuilds
the file most days, so the checksum, not the name, identifies these bytes.
result = pull(manifest)
item = result.one("tracks")
print("File:", item.path.name)
print("Bytes:", item.provenance.size)
print("Source:", item.provenance.source_url)
print("Retrieved (UTC):", item.provenance.retrieved_at.isoformat(timespec="seconds"))
print("Checksum:", item.provenance.checksum)
File: ibtracs.last3years.list.v04r01.csv
Bytes: 10521539
Source: https://www.ncei.noaa.gov/data/international-best-track-archive-for-climate-stewardship-ibtracs/v04r01/access/csv/ibtracs.last3years.list.v04r01.csv
Retrieved (UTC): 2026-09-24T06:11:31+00:00
Checksum: sha256:60c5782aadb85a16848df1b26d8723091a03663c6357a18af88176eb42b23e2b
Open
The CSV lays a units row under its header, so item.open() picks the
units-row reader and keeps the units in attrs["units"]. The table has one
row per three-hourly track point and 174 columns: identity (SID, SEASON,
BASIN, NAME), ISO_TIME in UTC without an offset, position (LAT,
LON), the responsible WMO agency's wind and pressure, then each agency's own
report in its own columns. The U.S. set (USA_WIND, USA_PRES, USA_SSHS)
is the most complete; USA_SSHS is the Saffir-Simpson category, with -5 to
-1 for depressions, subtropical, and post-tropical stages. TRACK_TYPE says
whether a storm's track is final (main) or still provisional.
tracks = item.open_csv(parse_dates=["ISO_TIME"])
units = tracks.attrs["units"]
columns = ["SID", "SEASON", "BASIN", "NAME", "ISO_TIME", "LAT", "LON", "USA_WIND", "USA_SSHS"]
print(f"{len(tracks):,} track points, {tracks['SID'].nunique()} storms, {tracks.shape[1]} columns")
print("Units:", {name: units[name] for name in ["LAT", "LON", "USA_WIND", "USA_PRES", "DIST2LAND"]})
print(f"Longitude runs from {tracks['LON'].min()} to {tracks['LON'].max()}")
print(tracks.groupby(["SEASON", "TRACK_TYPE"])["SID"].nunique().unstack(fill_value=0))
tracks[columns].head()
22,252 track points, 383 storms, 174 columns
Units: {'LAT': 'degrees_north', 'LON': 'degrees_east', 'USA_WIND': 'kts', 'USA_PRES': 'mb', 'DIST2LAND': 'km'}
Longitude runs from -179.5 to 257.4
TRACK_TYPE PROVISIONAL US-PROVISIONAL main
SEASON
2023 0 0 86
2024 0 0 101
2025 5 64 46
2026 79 2 0
| SID | SEASON | BASIN | NAME | ISO_TIME | LAT | LON | USA_WIND | USA_SSHS | |
|---|---|---|---|---|---|---|---|---|---|
| 0 | 2023005S18142 | 2023 | SP | HALE | 2023-01-04 18:00:00 | -18.2 | 142.0 | 20.0 | -3 |
| 1 | 2023005S18142 | 2023 | SP | HALE | 2023-01-04 21:00:00 | -18.1 | 142.5 | 20.0 | -3 |
| 2 | 2023005S18142 | 2023 | SP | HALE | 2023-01-05 00:00:00 | -18.1 | 143.0 | 20.0 | -3 |
| 3 | 2023005S18142 | 2023 | SP | HALE | 2023-01-05 03:00:00 | -18.1 | 143.5 | 20.0 | -3 |
| 4 | 2023005S18142 | 2023 | SP | HALE | 2023-01-05 06:00:00 | -18.1 | 144.1 | 20.0 | -3 |
Longitudes past 180 are not errors: a track that crosses the date line keeps its longitude continuous instead of jumping from 180 to -180, so its values run on past 180. Taking longitude modulo 360 puts every point on one 0 to 360 axis, centred on the Pacific.
A first look
Every track point of the four seasons in grey, and the whole tracks of the storms that reached category 4 or 5 on the U.S. one-minute wind, coloured by the basin each one started in.
peak = tracks.groupby("SID")["USA_SSHS"].max()
majors = tracks[tracks["SID"].isin(peak[peak >= 4].index)]
colors = {"WP": "#2563a6", "EP": "#3a9a6b", "NA": "#b45631", "NI": "#8c1d40"}
colors |= {"SI": "#7d5ba6", "SP": "#c08a1e"}
fig, ax = plt.subplots(layout="constrained")
ax.scatter(tracks["LON"] % 360, tracks["LAT"], s=1, color="#c8c8c8")
for _, storm in majors.groupby("SID"):
    lon = (storm["LON"] % 360).to_numpy()
    # Break the line where a track wraps across 0/360 degrees.
    lon = np.where(np.abs(np.diff(lon, prepend=lon[0])) > 180, np.nan, lon)
    ax.plot(lon, storm["LAT"], color=colors[storm["BASIN"].iloc[0]], linewidth=1)
for basin, color in colors.items():
    ax.plot([], [], color=color, label=basin)
ax.set_xlim(20, 360)
ax.set_ylim(-45, 60)
ax.set_xticks(range(30, 361, 30), [f"{x if x <= 180 else x - 360}" for x in range(30, 361, 30)])
ax.set_xlabel("Longitude (degrees east; negative is west)")
ax.set_ylabel("Latitude (degrees north)")
ax.set_title("IBTrACS, 2023 to 2026 seasons: storms that reached category 4 or 5")
ax.legend(title="Basin of origin", loc="lower left", fontsize=8, ncols=3)
plt.show()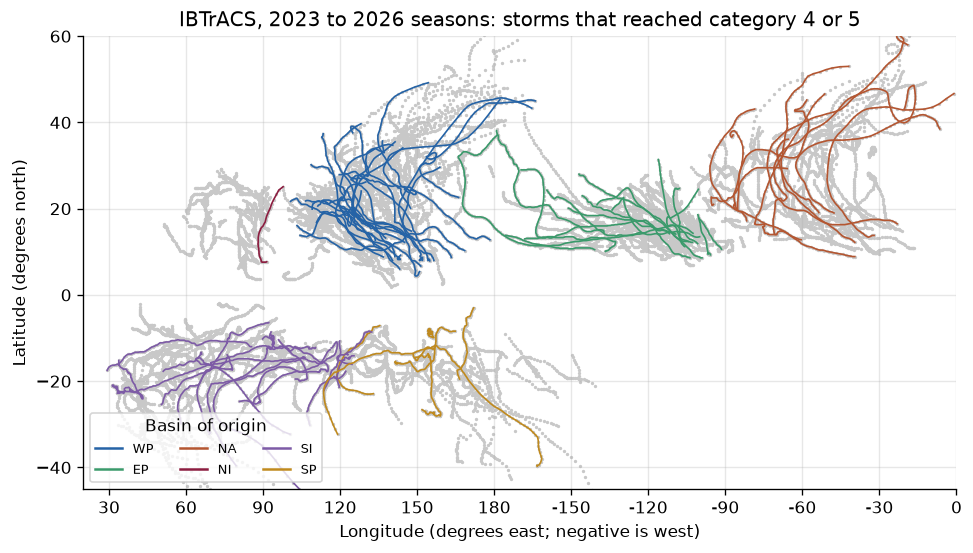
summary = majors.groupby("SID").agg(
    season=("SEASON", "first"),
    basin=("BASIN", "first"),
    track=("TRACK_TYPE", "first"),
    name=("NAME", "first"),
    wind_kt=("USA_WIND", "max"),
)
print(f"{len(summary)} storms reached category 4 or 5")
print(summary.groupby(["season", "basin"]).size().unstack(fill_value=0))
summary.sort_values("wind_kt", ascending=False).head(6)
76 storms reached category 4 or 5
basin EP NA NI SI SP WP
season
2023 7 3 1 2 2 7
2024 2 4 0 4 2 8
2025 3 4 0 7 1 5
2026 4 0 0 3 2 5
| season | basin | track | name | wind_kt | |
|---|---|---|---|---|---|
| SID | |||||
| 2023138N05151 | 2023 | WP | main | MAWAR | 165.0 |
| 2023279N08157 | 2023 | WP | main | BOLAVEN | 165.0 |
| 2025294N14290 | 2025 | NA | main | MELISSA | 165.0 |
| 2024279N21265 | 2024 | NA | main | MILTON | 155.0 |
| 2026099N09152 | 2026 | WP | PROVISIONAL | SINLAKU | 154.0 |
| 2026182N09163 | 2026 | WP | PROVISIONAL | BAVI | 154.0 |
The western North Pacific had the most category 4 and 5 storms of any basin, and the strongest peaks, 165 kt, came from Mawar and Bolaven there in 2023 and from Melissa in the North Atlantic in 2025. Counts for the current season are incomplete and rest partly on provisional tracks, and other agencies average wind over ten minutes, so their winds for the same storms run lower than the U.S. one-minute values used here.
Pin and cite
verify checks the cached file against the lockfile's checksum. NCEI keeps
no superseded builds, so a later pull from this lockfile finds different
bytes upstream and stops rather than replacing them; keep the cache with the
manifest and lockfile to reproduce the analysis, or pass
--update noaa:ibtracs to accept the current build. The citation below is
what a methods section needs, and usdata cite dataset.yaml prints the same.
assert verify(manifest) == []
for citation in cite_lockfile(manifest):
    print(citation.as_text())
noaa:ibtracs
Gahtan, J., K. R. Knapp, C. J. Schreck, H. J. Diamond, J. P. Kossin, and M. C. Kruk, 2024: International Best Track Archive for Climate Stewardship (IBTrACS) Project, Version 4r01. NOAA National Centers for Environmental Information, doi:10.25921/82ty-9e16. Knapp, K. R., M. C. Kruk, D. H. Levinson, H. J. Diamond, and C. J. Neumann, 2010: The International Best Track Archive for Climate Stewardship (IBTrACS). Bull. Amer. Meteor. Soc., 91, 363-376
homepage: https://www.ncei.noaa.gov/products/international-best-track-archive
license: US Government Work (public domain)
terms: https://www.ncei.noaa.gov/products/international-best-track-archive
retrieved: 2026-09-24; 1 checksummed asset (10,521,539 bytes) pinned by usdata 0.26.0
sources: tracks
What was awkward
- NCEI rebuilds the file in place under the same name most days, and keeps no old builds. The checksum in the lockfile is the only pin, and a superseded build cannot be downloaded again.
ISO_TIMEhas no offset. It is UTC by the IBTrACS documentation, butparse_datesmakes it a naive timestamp.- Longitude is continuous along each track, so a date-line crosser runs past 180°. Mapping needs a modulo and a break where a track wraps.
BASINbelongs to each point, not each storm. Dora (2023) went from the eastern into the western North Pacific and back, so drawing or counting by basin needs a rule; here a storm counts in the basin it started in.- 174 columns, most of them one agency's view of the same storm. Winds are not comparable across agencies: the U.S. uses one-minute sustained wind, most others ten-minute.
TRACK_TYPEhas to be read before comparing seasons: the latest seasons are mostlyPROVISIONALorUS-PROVISIONALoperational tracks that the agencies will revise.- IBTrACS writes a single space for a missing value, and the North Atlantic
basin code is
NA, which plainpandas.read_csvturns into a missing value; the usdata reader keeps it as text.