 usdata
The USGS Earthquake Hazards Program serves the ANSS Comprehensive Catalog (ComCat), the combined earthquake catalog of the U.S. seismic networks, through the FDSN event web service. A query names a time window and optionally a box and magnitude or depth bounds, and the answer is one CSV of fixed columns with one row per event: origin time, epicenter, depth, magnitude, and review status. A response holds at most 20,000 events, so a larger selection arrives as several pages.
This walkthrough pulls every magnitude 3.0 or larger earthquake in
Oklahoma's bounding box from 2000 to 2024 and counts them by year. It needs
usdata[pandas] and matplotlib; the CSV is under 1 MB and the run takes a
few seconds.
from datetime import UTC, datetime
from pathlib import Path

import matplotlib.pyplot as plt
import pandas as pd

import usdata
from usdata import cite_lockfile, pull, verify

# One figure style for every usdata notebook, so previews look alike.
plt.rcParams.update(
    {
        "figure.figsize": (8, 4.5),
        "figure.dpi": 120,
        "axes.spines.top": False,
        "axes.spines.right": False,
        "axes.grid": True,
        "grid.alpha": 0.3,
        "font.size": 10,
    }
)
manifest = Path("dataset.yaml")
print("Executed (UTC):", datetime.now(UTC).isoformat(timespec="seconds"))
print(f"usdata {usdata.__version__}; pandas {pd.__version__}")
Executed (UTC): 2026-09-24T06:02:42+00:00
usdata 0.26.0; pandas 3.0.6
Select
The service filters on its side, so the manifest's query is the answer.
location: Oklahoma becomes the state's bounding box, which takes in strips
of Kansas, Texas, and Arkansas. Bare dates are whole UTC days, so the window
runs from the first instant of 2000 to the last of 2024. min_magnitude: 3.0
applies to each event's own magnitude, whatever scale that is. Smaller events
are left out because Oklahoma's seismic network grew much denser after 2010,
and counting them would mix a change in the earth with a change in detection.
The source is named quakes so the code below can ask for it by name.
print(manifest.read_text())name: oklahoma-earthquakes
sources:
- name: quakes
dataset: usgs:earthquakes
# Oklahoma's bounding box, so the edges of Kansas, Texas, and Arkansas count too.
location: Oklahoma
start: 2000-01-01
end: 2024-12-31
params:
min_magnitude: 3.0
What arrives
Listing first asks the service how many events match, then makes one asset
per page of up to 20,000 events. Three thousand events fit on one page. The
first pull writes dataset.lock.json beside the manifest with the page's
checksum.
result = pull(manifest)
pages = result.by_source["quakes"]
print("Pages:", len(pages))
item = pages[0]
print("File:", item.path.name)
print("Bytes:", item.provenance.size)
print("Source:", item.provenance.source_url)
print("Retrieved (UTC):", item.provenance.retrieved_at.isoformat(timespec="seconds"))
print("Checksum:", item.provenance.checksum)
Pages: 1
File: comcat_20000101_20241231_4116d7f38277d776ec1c.csv
Bytes: 517588
Source: https://earthquake.usgs.gov/fdsnws/event/1/query?starttime=2000-01-01T00%3A00%3A00&endtime=2024-12-31T23%3A59%3A59.999999&minmagnitude=3&minlatitude=33.6158&maxlatitude=37.0022&minlongitude=-103.003&maxlongitude=-94.4307&format=csv&orderby=time-asc&limit=20000&offset=1
Retrieved (UTC): 2026-09-24T06:03:07+00:00
Checksum: sha256:68a410e38b2fec7ac8745f622ac676f2d676f82a06cb0c7d375a1541da1bec70
Open
The generic CSV reader returns a DataFrame; parse_dates makes time (the
origin time) and updated (the last revision) UTC timestamps. latitude and
longitude are the epicenter in decimal degrees, depth is kilometers below
sea level, and place is a phrase such as "5 km NW of Pawnee, Oklahoma".
mag is on the scale magType names, so magnitudes of different types are
not strictly comparable. status is automatic until a network reviews the
event.
events = item.open_csv(parse_dates=["time", "updated"])
print(f"{len(events)} events, {events['time'].min():%Y-%m-%d} to {events['time'].max():%Y-%m-%d}")
print("Status:", events["status"].value_counts().to_dict())
print("Magnitude types:", events["magType"].value_counts().to_dict())
print("Located by:", events["locationSource"].value_counts().head(3).to_dict())
print(f"Depth: median {events['depth'].median():.1f} km, maximum {events['depth'].max():.1f} km")
columns = ["time", "place", "mag", "magType", "depth"]
events.nlargest(5, "mag")[columns]
3016 events, 2000-08-07 to 2024-11-29
Status: {'reviewed': 3016}
Magnitude types: {'ml': 2312, 'mwr': 495, 'mb_lg': 98, 'mblg': 81, 'md': 15, 'mww': 9, 'mb': 5, 'mwc': 1}
Located by: {'tul': 2661, 'ok': 189, 'us': 151}
Depth: median 5.5 km, maximum 28.6 km
| time | place | mag | magType | depth | |
|---|---|---|---|---|---|
| 2240 | 2016-09-03 12:02:44.400000+00:00 | 14 km NW of Pawnee, Oklahoma | 5.80 | mww | 5.557 |
| 105 | 2011-11-06 03:53:10+00:00 | 8 km NW of Prague, Oklahoma | 5.70 | mww | 5.200 |
| 1897 | 2016-02-13 17:07:06.290000+00:00 | 18 km SE of Waynoka, Oklahoma | 5.10 | mww | 8.310 |
| 2996 | 2024-02-03 05:24:28.269000+00:00 | 8 km NW of Prague, Oklahoma | 5.06 | mww | 3.000 |
| 2348 | 2016-11-07 01:44:24.500000+00:00 | 3 km W of Cushing, Oklahoma | 5.00 | mww | 4.430 |
Almost every event here is shallow, a few kilometers down. Most were located
by the Oklahoma Geological Survey (locationSource tul or ok) and carry
its local magnitude ml; many of the larger ones carry a moment magnitude
(mwr, mww) instead.
A first look
Magnitude 3 and larger earthquakes per year.
per_year = events.groupby(events["time"].dt.year).size().reindex(range(2000, 2025), fill_value=0)
fig, ax = plt.subplots(layout="constrained")
ax.bar(per_year.index, per_year.values, color="#b45631")
ax.set_xlabel("Year (UTC)")
ax.set_ylabel("Earthquakes of magnitude 3.0 or more")
ax.set_title("Oklahoma earthquakes of magnitude 3 or more per year, 2000 to 2024 (USGS ComCat)")
plt.show()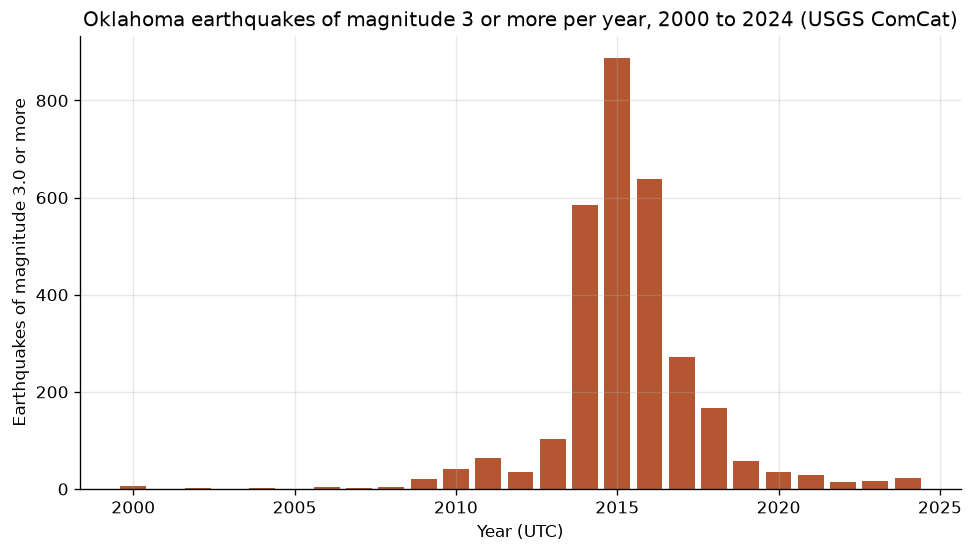
early = per_year.loc[2000:2008]
print(f"2000 to 2008: {early.sum()} events in nine years")
print(f"Peak: {per_year.idxmax()} with {per_year.max()}")
surge = per_year.loc[2014:2016].sum()
print(f"2014 to 2016: {surge} events ({surge / per_year.sum():.0%} of the total)")
print(f"2024: {per_year[2024]}")
strongest = events.loc[events["mag"].idxmax()]
when = f"{strongest['time']:%Y-%m-%d}"
print(f"Largest: M{strongest['mag']} ({strongest['magType']}) on {when}, {strongest['place']}")
2000 to 2008: 25 events in nine years
Peak: 2015 with 888
2014 to 2016: 2112 events (70% of the total)
2024: 23
Largest: M5.8 (mww) on 2016-09-03, 14 km NW of Pawnee, Oklahoma
Oklahoma went from 25 magnitude 3 earthquakes in nine years (2000 to 2008) to 888 in 2015 alone; 2014 to 2016 hold 70% of the quarter century's events, including the largest, magnitude 5.8 near Pawnee in September 2016. By 2020 the rate was back to a few dozen a year. The USGS and the Oklahoma Geological Survey attribute the surge to the disposal of oil and gas wastewater in deep wells; the decline followed state orders from 2015 to cut injection volumes. The catalog shows the timing; it does not by itself show the cause.
Pin and cite
verify checks the cached page against the lockfile's checksum. Keep the
manifest and lockfile with your analysis; the citation below is what a
methods section needs, and usdata cite dataset.yaml prints the same.
assert verify(manifest) == []
for citation in cite_lockfile(manifest):
    print(citation.as_text())
usgs:earthquakes
U.S. Geological Survey, Earthquake Hazards Program, 2017, Advanced National Seismic System (ANSS) Comprehensive Catalog of Earthquake Events and Products, doi:10.5066/F7MS3QZH
homepage: https://earthquake.usgs.gov/fdsnws/event/1/
license: US Government Work (public domain)
terms: https://www.usgs.gov/information-policies-and-instructions/copyrights-and-credits
retrieved: 2026-09-24; 1 checksummed asset (517,588 bytes) pinned by usdata 0.26.0
sources: quakes
What was awkward
- A place name is a bounding box, not a boundary. Oklahoma's box includes
events in Kansas and the Texas Panhandle; filter on coordinates or
placefor the state alone. placeis free text for people, not a field for code: most rows end in "Oklahoma", some in "OK", and older ones name a region such as "Texas Panhandle region".magTypemixes scales, and spells one of them two ways (mb_lgandmblg). Filtering or averaging onmagtreats them as one scale.- The catalog is revised as networks review events, so
updatedmoves and a later pull of the same window can report drift;usdata pull --updateaccepts the revised page. With 25 years in one page, one revised event anywhere in them changes the page's checksum. - A window with no events fails with
EmptySourceunless the source setsallow_empty: true. That is correct, but the first run of a quiet window reads like a broken query rather than an empty answer. The earthquake guide covers paging, bounds, and revisions.