usdata
USGS daily values are one statistic per day, usually the mean, computed from the continuous record at each of its stream gages, wells, and water-quality monitoring sites: streamflow, gage height, water temperature, and hundreds of other parameters. The USGS publishes them through the Water Data OGC API; a request returns CSV with one row per site, parameter, statistic, and day, carrying its units, approval status, and qualifiers.
This walkthrough pulls water year 2024, 1 October 2023 to 30 September 2024,
of daily mean streamflow for the Arkansas River at Tulsa, Oklahoma. It needs
usdata[pandas] and matplotlib, downloads about 60 kB, and runs in a few
seconds.
from datetime import UTC, datetime
from pathlib import Path

import matplotlib.dates as mdates
import matplotlib.pyplot as plt
import pandas as pd

import usdata
from usdata import cite_lockfile, pull, verify

# One figure style for every usdata notebook, so previews look alike.
plt.rcParams.update(
    {
        "figure.figsize": (8, 4.5),
        "figure.dpi": 120,
        "axes.spines.top": False,
        "axes.spines.right": False,
        "axes.grid": True,
        "grid.alpha": 0.3,
        "font.size": 10,
    }
)
manifest = Path("dataset.yaml")
print("Executed (UTC):", datetime.now(UTC).isoformat(timespec="seconds"))
print(f"usdata {usdata.__version__}; pandas {pd.__version__}")
Executed (UTC): 2026-09-24T06:07:36+00:00
usdata 0.26.0; pandas 3.0.6
Select
The manifest names one site, one parameter, one statistic, and a window.
07164500 is the gage's site number; USGS-07164500 also works, and a
bbox or place selects every site inside it instead. 00060 is the
parameter code for discharge and 00003 the statistic code for the daily
mean, the default; codes are quoted so YAML keeps their leading zeros. Dates
are inclusive local calendar dates. The window is a USGS water year, which
runs October to September and is named for the year it ends in.
print(manifest.read_text())name: tulsa-streamflow
sources:
- dataset: usgs:water-daily
start: 2023-10-01
end: 2024-09-30
variables: ["00060"]
params:
sites: "07164500"
statistic_id: "00003"
What arrives
The adapter pages through the API and downloads each page as raw CSV; one
water year at one site fits on a single page. The first pull writes
dataset.lock.json beside the manifest, pinning each file's checksum. The API
offers no immutable versions, so the lockfile and cache are the only record
of which values this analysis used.
result = pull(manifest)
print("Files:", len(result.fetched))
for item in result.fetched:
    print("File:", item.path.name)
    print("Bytes:", item.provenance.size)
    print("Source:", item.provenance.source_url)
    print("Retrieved (UTC):", item.provenance.retrieved_at.isoformat(timespec="seconds"))
    print("Checksum:", item.provenance.checksum)
Files: 1
File: daily_6e5b9ff3d15cda7ced8b.csv
Bytes: 60748
Source: https://api.waterdata.usgs.gov/ogcapi/v0/collections/daily/items?f=csv&time=2023-10-01%2F2024-09-30&statistic_id=00003&limit=10000&monitoring_location_id=USGS-07164500¶meter_code=00060&offset=0
Retrieved (UTC): 2026-09-24T06:07:37+00:00
Checksum: sha256:6b90b015313d14c9d7a142f3ea1616a21370f8132d09ac3676ad7dc0da5fc92b
Open
The generic CSV reader returns a DataFrame with one row per day. time is
the local calendar date as text, value the daily mean, and
unit_of_measure its unit, cubic feet per second: the API has no metric
option. x and y are the site's longitude and latitude. approval_status
says whether the USGS has reviewed a value, qualifier flags values such as
estimates, and last_modified records when each row last changed. Rows do
not arrive in date order, so sort after parsing time. A day without a value
has no row at all, so compare against the full calendar to find gaps.
frame = pd.concat([item.open() for item in result.fetched], ignore_index=True)
frame["time"] = pd.to_datetime(frame["time"])
frame = frame.sort_values("time", ignore_index=True)
print(f"{len(frame)} rows, {frame['time'].min():%Y-%m-%d} to {frame['time'].max():%Y-%m-%d}")
missing = pd.date_range("2023-10-01", "2024-09-30").difference(frame["time"])
print("Days with no row:", missing.strftime("%Y-%m-%d").tolist())
print(
    "Site:", frame["monitoring_location_id"].iloc[0], "at", frame["y"].iloc[0], frame["x"].iloc[0]
)
print("Units:", frame["unit_of_measure"].unique().tolist())
print("Approval:", frame["approval_status"].value_counts().to_dict())
print("Qualifier:", frame["qualifier"].value_counts(dropna=False).to_dict())
print("Last modified:", frame["last_modified"].str[:10].value_counts().to_dict())
frame[["time", "value", "unit_of_measure", "approval_status", "qualifier"]].head()
365 rows, 2023-10-01 to 2024-09-29
Days with no row: ['2024-09-30']
Site: USGS-07164500 at 36.140648067526 -96.0063865713339
Units: ['ft^3/s']
Approval: {'Approved': 365}
Qualifier: {nan: 190, "['ESTIMATED']": 175}
Last modified: {'2025-05-01': 342, '2025-08-01': 23}
| time | value | unit_of_measure | approval_status | qualifier | |
|---|---|---|---|---|---|
| 0 | 2023-10-01 | 297.0 | ft^3/s | Approved | NaN |
| 1 | 2023-10-02 | 719.0 | ft^3/s | Approved | ['ESTIMATED'] |
| 2 | 2023-10-03 | 480.0 | ft^3/s | Approved | ['ESTIMATED'] |
| 3 | 2023-10-04 | 2240.0 | ft^3/s | Approved | NaN |
| 4 | 2023-10-05 | 1480.0 | ft^3/s | Approved | NaN |
A first look
A water year of daily mean flow on a logarithmic axis, with the days the USGS qualifies as estimated marked.
CUBIC_METRES_PER_CUBIC_FOOT = 0.0283168
estimated = frame["qualifier"].fillna("").str.contains("ESTIMATED")

fig, ax = plt.subplots(layout="constrained")
ax.plot(frame["time"], frame["value"], color="#2563a6", linewidth=1, label="Daily mean")
ax.scatter(
    frame.loc[estimated, "time"],
    frame.loc[estimated, "value"],
    color="#b45631",
    s=6,
    zorder=3,
    label="Qualified as estimated",
)
ax.set_yscale("log")
ax.set_ylabel("Discharge (ft³/s)")
metric = ax.secondary_yaxis(
    "right",
    functions=(
        lambda cfs: cfs * CUBIC_METRES_PER_CUBIC_FOOT,
        lambda cms: cms / CUBIC_METRES_PER_CUBIC_FOOT,
    ),
)
metric.set_ylabel("Discharge (m³/s)")
ax.xaxis.set_major_formatter(mdates.DateFormatter("%b\n%Y"))
ax.set_xlabel("Date")
ax.set_title("Arkansas River at Tulsa, Oklahoma (USGS 07164500): water year 2024")
ax.legend(loc="upper left", fontsize=8, frameon=False)
plt.show()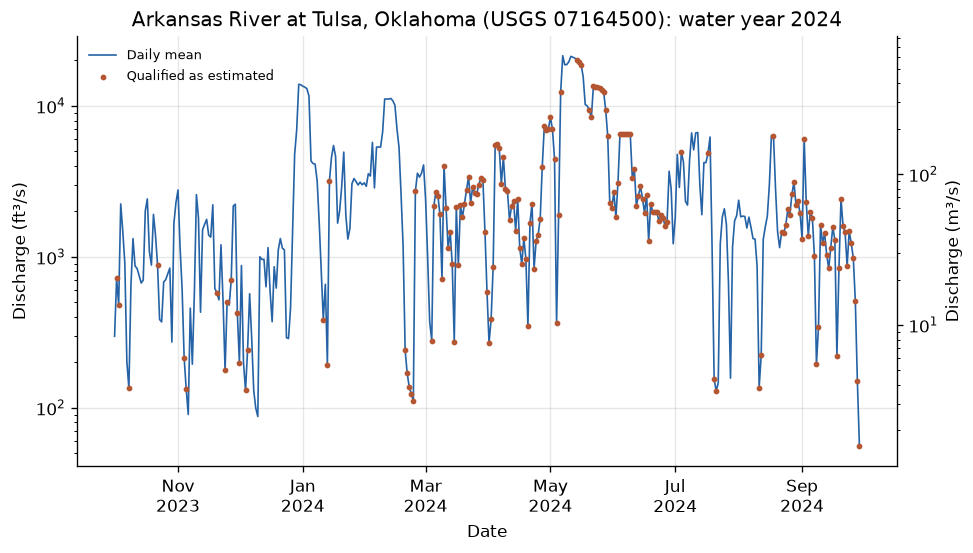
peak = frame.loc[frame["value"].idxmax()]
low = frame.loc[frame["value"].idxmin()]
monthly = frame.groupby(frame["time"].dt.to_period("M"))["value"].mean()
print(f"Peak daily mean: {peak['value']:,.0f} ft³/s on {peak['time']:%Y-%m-%d}")
print(f"Lowest daily mean: {low['value']:,.1f} ft³/s on {low['time']:%Y-%m-%d}")
print(f"Ratio of highest to lowest: {peak['value'] / low['value']:,.0f}")
print(f"Median daily mean: {frame['value'].median():,.0f} ft³/s")
print(
    f"May 2024 mean: {monthly['2024-05']:,.0f} ft³/s; water-year mean: {frame['value'].mean():,.0f}"
)
print(f"Days qualified as estimated: {int(estimated.sum())} of {len(frame)}")
Peak daily mean: 21,500 ft³/s on 2024-05-07
Lowest daily mean: 55.6 ft³/s on 2024-09-29
Ratio of highest to lowest: 387
Median daily mean: 1,860 ft³/s
May 2024 mean: 12,470 ft³/s; water-year mean: 3,291
Days qualified as estimated: 175 of 365
Daily flow at Tulsa spanned a factor of almost 400 in one year, around a median near 1,900 ft³/s. The gage is downstream of Keystone Dam, and the record looks managed as much as natural: flat-topped stretches near 14,000 ft³/s in late December and near 20,000 ft³/s for two weeks after the early-May storms, and one-day drops to a few hundred ft³/s, fit a reservoir's release schedule better than rainfall alone. Almost half the year's values are qualified as estimated although every row is approved, which matters to anyone reading "approved" as "measured".
Pin and cite
verify checks the cached file against the lockfile's checksum. The USGS
revises daily values, as last_modified shows, so keep the cache with the
manifest and lockfile. usdata cite dataset.yaml prints the same citation.
assert verify(manifest) == []
for citation in cite_lockfile(manifest):
    print(citation.as_text())
usgs:water-daily
U.S. Geological Survey, Water Data for the Nation daily values, accessed via usdata
homepage: https://api.waterdata.usgs.gov/
license: US Government Work (public domain)
terms: https://www.usgs.gov/information-policies-and-instructions/copyrights-and-credits
retrieved: 2026-09-24; 1 checksummed asset (60,748 bytes) pinned by usdata 0.26.0
sources: 1
What was awkward
- Rows arrive out of date order, so a line plot of the raw frame zigzags
until it is sorted on a parsed
time. qualifieris a Python-style list written as text, such as['ESTIMATED'], so filtering on it means string matching or parsing.approval_statusandqualifierare separate: an approved value can still be an estimate, and nothing in the column names says so.- Discharge comes only in cubic feet per second; there is no request option for metric units, so the conversion is the reader's job.
- The site number and the monitoring location ID differ by the
USGS-prefix; the manifest accepts either, but joining against other tables needs one form chosen deliberately. - The API has no versioned snapshots.
last_modifiedshows rows changing months after the water year ended, so the same request can return different bytes later. - Water year 2024 has 366 days but returned 365 rows: 30 September 2024 has no value, and the API leaves the day out rather than returning an empty one. The gap is easy to miss unless the dates are checked against a calendar.