 usdata
A strong El Niño was building through the summer of 2026, and "super El Niño" has been the phrase in the news. This study asks what past strong El Niño winters did to snowfall across the United States, region by region, using the longest and most complete station records NOAA keeps, and classifying winters by the index NOAA now uses officially.
It describes tendencies, not a forecast. Only eight winters since 1949 reached
the strong threshold on the official index, so every regional figure rests on
eight seasons, and a single winter can land anywhere. The study needs
usdata[pandas] and matplotlib, downloads about 200 MB, and runs in about a
minute.
Show code
from datetime import UTC, datetime
from pathlib import Path

import matplotlib.pyplot as plt
import numpy as np
import pandas as pd

import usdata
from usdata import cite_lockfile, pull, verify

# One figure style for every usdata notebook, so previews look alike.
plt.rcParams.update(
    {
        "figure.figsize": (8, 4.5),
        "figure.dpi": 120,
        "axes.spines.top": False,
        "axes.spines.right": False,
        "axes.grid": True,
        "grid.alpha": 0.3,
        "font.size": 10,
    }
)
manifest = Path("dataset.yaml")
print("Executed (UTC):", datetime.now(UTC).isoformat(timespec="seconds"))
print(f"usdata {usdata.__version__}; pandas {pd.__version__}")
Executed (UTC): 2026-09-29T03:50:48+00:00
usdata 0.32.0; pandas 3.0.6
Data
One manifest names nine sources:
- GSOM station files,
seven sources named by region, each the whole monthly record of its
stations. The stations are every U.S. Historical Climatology Network (USHCN)
station whose GHCN-Daily snowfall record runs from 1950 or earlier to 2025 or
later, in seven regional boxes across the northern tier and the South.
USHCN stations are the ones NOAA chose for long, stable,
complete records, so no station was picked by its snowfall. The rule was
applied to NCEI's
ghcnd-stations.txtandghcnd-inventory.txtof 24 September 2026; the boxes are listed below. - CPC ENSO indices,
roniandoni: the Relative Oceanic Niño Index, NOAA's official ENSO index since February 2026, and the traditional Oceanic Niño Index.
Show code
REGIONS = {  # west, south, east, north in degrees; each box is half-open
    "pacific-northwest": (-125.0, 42.0, -116.5, 49.0),
    "northern-rockies": (-116.5, 43.0, -104.0, 49.0),
    "upper-midwest": (-97.5, 43.5, -87.0, 49.0),
    "great-lakes-ohio-valley": (-89.0, 38.0, -78.0, 43.5),
    "northeast": (-78.0, 36.5, -67.0, 47.5),
    "southern-plains": (-104.0, 32.0, -94.0, 37.0),
    "southwest": (-114.0, 31.3, -104.0, 37.0),
}
result = pull(manifest)
for region in REGIONS:
    items = result.by_source[region]
    size = sum(item.provenance.size for item in items)
    print(f"{region:24} {len(items):3} stations  {size / 1e6:5.1f} MB")
print("Retrieved (UTC):", result.one("roni").provenance.retrieved_at.isoformat(timespec="seconds"))
pacific-northwest 44 stations 28.9 MB
northern-rockies 40 stations 25.0 MB
upper-midwest 40 stations 27.4 MB
great-lakes-ohio-valley 74 stations 49.8 MB
northeast 70 stations 45.1 MB
southern-plains 28 stations 18.5 MB
southwest 19 stations 12.1 MB
Retrieved (UTC): 2026-09-29T03:47:50+00:00
Classifying winters
A winter here is November to March, named by the year it starts, from 1949-50 to 2025-26. Its strength is the peak of the three-month index over OND, NDJ, and DJF, the seasons when El Niño usually peaks, and a strong El Niño winter is one whose peak reaches +1.5 °C. That threshold is a convention for "strong", not a CPC definition.
Show code
FIRST, LAST, STRONG = 1949, 2025, 1.5


def winter_peaks(name: str) -> pd.Series:
    """The peak OND, NDJ, or DJF value of one CPC index, per winter."""
    table = pd.read_csv(result.one(name).path, sep=r"\s+")
    table = table[table["SEAS"].isin(["OND", "NDJ", "DJF"])]
    winter = table["YR"] - (table["SEAS"] == "DJF")
    return table["ANOM"].groupby(winter).max().loc[FIRST:LAST]


peaks = pd.DataFrame({"RONI": winter_peaks("roni"), "ONI": winter_peaks("oni")})
strong = {name: sorted(peaks.index[peaks[name] >= STRONG]) for name in peaks}
table = peaks.loc[sorted(set(strong["RONI"]) | set(strong["ONI"]))]
table.index = [f"{year}-{str(year + 1)[2:]}" for year in table.index]
table| RONI | ONI | |
|---|---|---|
| 1957-58 | 1.89 | 1.69 |
| 1965-66 | 1.99 | 1.82 |
| 1972-73 | 1.97 | 1.84 |
| 1982-83 | 2.40 | 2.14 |
| 1991-92 | 2.12 | 1.54 |
| 1997-98 | 2.28 | 2.37 |
| 2009-10 | 1.50 | 1.50 |
| 2015-16 | 2.25 | 2.59 |
| 2023-24 | 1.42 | 1.99 |
The two indices agree on eight strong winters. The traditional ONI adds 2023-24, which RONI reads as 1.42: it measures Niño 3.4 against the rest of the tropics, which were unusually warm that winter. The composites below use RONI.
Winter snowfall
GSOM leaves a month blank when more than five of its days are missing or flagged, so a winter counts at a station only when all five months have a value. A station stays in the study with at least 60 complete winters of the 77, at least six of the eight strong ones, and a median winter of at least 10 cm, below which a ratio of snowfall means little.
Show code
frames = []
for region in REGIONS:
    for item in result.by_source[region]:
        frame = pd.read_csv(
            item.path,
            usecols=["STATION", "DATE", "LATITUDE", "LONGITUDE", "ELEVATION", "SNOW"],
            dtype={"STATION": "string"},
        )
        frames.append(frame.assign(region=region))
monthly = pd.concat(frames, ignore_index=True)
month = monthly["DATE"].str[5:].astype(int)
monthly = monthly[month.isin([11, 12, 1, 2, 3])].copy()
monthly["winter"] = monthly["DATE"].str[:4].astype(int) - (monthly["DATE"].str[5:].astype(int) <= 3)
monthly = monthly[monthly["winter"].between(FIRST, LAST)]
stations = monthly.groupby("STATION")[["region", "LATITUDE", "LONGITUDE", "ELEVATION"]].first()

counts = monthly.groupby(["STATION", "winter"])["SNOW"].agg(["count", "sum"])
winters = counts["sum"].where(counts["count"] == 5).unstack("winter") / 10  # cm
complete = winters.notna().sum(axis=1)
complete_strong = winters[strong["RONI"]].notna().sum(axis=1)
usual = winters.median(axis=1)
keep = (complete >= 60) & (complete_strong >= 6) & (usual >= 10)
long_record = complete >= 60
enough_strong = long_record & (complete_strong >= 6)
print(f"{len(winters)} stations; kept {int(keep.sum())}")
print(f"  fewer than 60 complete winters: {int((~long_record).sum())}")
print(f"  fewer than 6 complete strong winters: {int((long_record & ~enough_strong).sum())}")
print(f"  median winter under 10 cm: {int((enough_strong & (usual < 10)).sum())}")
snow = winters[keep]
stations = stations.loc[snow.index]
stations.groupby("region").size().rename("stations").to_frame().T
315 stations; kept 158
fewer than 60 complete winters: 133
fewer than 6 complete strong winters: 11
median winter under 10 cm: 13
| region | great-lakes-ohio-valley | northeast | northern-rockies | pacific-northwest | southern-plains | southwest | upper-midwest |
|---|---|---|---|---|---|---|---|
| stations | 46 | 43 | 11 | 17 | 8 | 6 | 27 |
Strong El Niño winters against the usual
For each station, the ratio is its median snowfall in the strong El Niño winters over its median in all winters: 0.5 is half its usual snow, 2 is double. A region's figure is the median of its stations' ratios. To judge whether a figure could be chance, the same calculation is repeated 2,000 times with eight winters drawn at random, and the share of draws at least as far from 1 as the real one is reported as a two-sided p-value.
Show code
def ratios(table: pd.DataFrame, chosen) -> pd.Series:
    """Each station's median snowfall in the chosen winters over its median in all."""
    return table[list(chosen)].median(axis=1) / table.median(axis=1)


stations["ratio"] = ratios(snow, strong["RONI"])
regions = stations.groupby("region")["ratio"].agg(
    stations="size", median_ratio="median", share_below=lambda r: (r < 1).mean()
)
rng = np.random.default_rng(1950)
draws = np.array(
    [
        ratios(snow, rng.choice(snow.columns, size=len(strong["RONI"]), replace=False))
        .groupby(stations["region"])
        .median()
        .reindex(regions.index)
        for _ in range(2000)
    ]
)
distance = np.abs(np.log(regions["median_ratio"].to_numpy()))
regions["p"] = (np.abs(np.log(draws)) >= distance).mean(axis=0)
by_winter = (
    snow[strong["RONI"]].div(snow.median(axis=1), axis=0).groupby(stations["region"]).median()
)
regions["strong_winters_below"] = (by_winter < 1).sum(axis=1).astype(int)
regions = regions.loc[list(REGIONS)]
regions.round(2)| stations | median_ratio | share_below | p | strong_winters_below | |
|---|---|---|---|---|---|
| region | |||||
| pacific-northwest | 17 | 0.57 | 0.94 | 0.00 | 7 |
| northern-rockies | 11 | 0.80 | 1.00 | 0.02 | 8 |
| upper-midwest | 27 | 0.83 | 0.96 | 0.11 | 6 |
| great-lakes-ohio-valley | 46 | 0.78 | 0.85 | 0.03 | 7 |
| northeast | 43 | 0.92 | 0.74 | 0.45 | 5 |
| southern-plains | 8 | 1.84 | 0.00 | 0.05 | 2 |
| southwest | 6 | 1.39 | 0.00 | 0.07 | 2 |
A first look
Show code
fig, ax = plt.subplots(layout="constrained")
mesh = ax.scatter(
    stations["LONGITUDE"],
    stations["LATITUDE"],
    c=np.log2(stations["ratio"]),
    cmap="BrBG",
    vmin=-1.5,
    vmax=1.5,
    s=22,
    edgecolor="0.3",
    linewidth=0.3,
)
for west, south, east, north in REGIONS.values():
    ax.add_patch(
        plt.Rectangle(
            (west, south),
            east - west,
            north - south,
            fill=False,
            edgecolor="0.6",
            linewidth=0.6,
            linestyle="--",
        )
    )
ax.set_aspect(1 / np.cos(np.radians(40)))
ax.grid(False)
ax.set_xlabel("Longitude (degrees east)")
ax.set_ylabel("Latitude (degrees north)")
ax.set_title("Snowfall in strong El Niño winters, relative to each station's usual")
bar = fig.colorbar(mesh, ax=ax, shrink=0.75, ticks=np.log2([0.35, 0.5, 0.71, 1, 1.41, 2, 2.83]))
bar.ax.set_yticklabels(["35%", "50%", "71%", "100%", "141%", "200%", "283%"])
bar.set_label("Median in the 8 strong winters / median in all 77")
plt.show()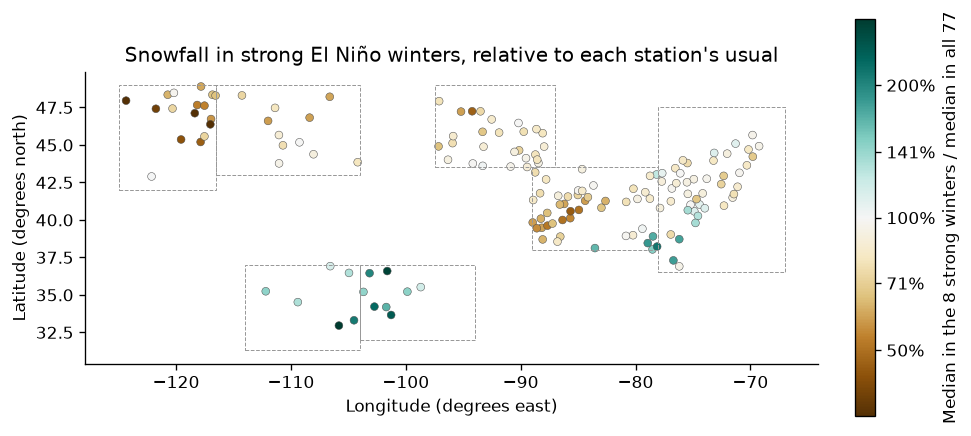
The pattern is the one the atmosphere's response to El Niño predicts: the Pacific jet stream shifts south, so the Pacific Northwest and northern Rockies get less snow and the southern tier more. In the eight strong winters, the median Pacific Northwest station got a little over half its usual snowfall, and 85 to 100 percent of the stations in each of the four northern interior regions got less than usual. Random draws of eight winters rarely do as well there (p of 0.03 or less), except in the Upper Midwest (0.11). The southern Plains and the Southwest got more, though from only 8 and 6 stations. The Northeast, where coastal storms can go either way, shows no clear shift.
When the indices disagree: 2023-24
The one winter the two indices classify differently is 2023-24: strong on the traditional ONI (1.99), not on RONI (1.42). Its snowfall is shown against each region's strong-winter median.
Show code
last_winter = (snow[2023] / snow.median(axis=1)).groupby(stations["region"]).median()
comparison = pd.DataFrame(
    {
        "strong El Niño winters": regions["median_ratio"],
        "2023-24": last_winter.reindex(regions.index),
    }
)
comparison.round(2)| strong El Niño winters | 2023-24 | |
|---|---|---|
| region | ||
| pacific-northwest | 0.57 | 0.71 |
| northern-rockies | 0.80 | 0.82 |
| upper-midwest | 0.83 | 0.52 |
| great-lakes-ohio-valley | 0.78 | 0.47 |
| northeast | 0.92 | 0.53 |
| southern-plains | 1.84 | 0.70 |
| southwest | 1.39 | 0.96 |
2023-24 was a low-snow winter nearly everywhere in the north, well below even the strong-winter composite in the Great Lakes, Upper Midwest, and Northeast, and it did not bring the southern tier its usual strong-El Niño boost. Counting it, as the traditional index would, weakens the southern figures, from 1.84 to 1.67 in the southern Plains and from 1.39 to 1.27 in the Southwest, and moves the northern ones by 0.01 to 0.06.
Show code
with_2023 = stations.assign(ratio_oni=ratios(snow, strong["ONI"]))
with_2023.groupby("region")[["ratio", "ratio_oni"]].median().loc[list(REGIONS)].round(2)| ratio | ratio_oni | |
|---|---|---|
| region | ||
| pacific-northwest | 0.57 | 0.63 |
| northern-rockies | 0.80 | 0.81 |
| upper-midwest | 0.83 | 0.78 |
| great-lakes-ohio-valley | 0.78 | 0.75 |
| northeast | 0.92 | 0.87 |
| southern-plains | 1.84 | 1.67 |
| southwest | 1.39 | 1.27 |
What this suggests for 2026-27
CPC's latest season in these tables is JJA 2026: RONI +1.36 and ONI +1.80. Whether the winter reaches the strong threshold on the official index depends on how the event develops through the autumn, which these tables cannot say.
Show code
roni = pd.read_csv(result.one("roni").path, sep=r"\s+")
oni = pd.read_csv(result.one("oni").path, sep=r"\s+")
latest = roni.iloc[-1]
print(
    f"Latest season: {latest['SEAS']} {latest['YR']}: RONI {latest['ANOM']:+.2f}, "
    f"ONI {oni.iloc[-1]['ANOM']:+.2f}"
)
print("\nIf 2026-27 is a strong El Niño winter, the eight past ones suggest:")
for region, row in regions.iterrows():
    print(
        f"  {region:24} median {row['median_ratio']:.0%} of usual; "
        f"{int(row['strong_winters_below'])} of 8 strong winters below usual"
    )
Latest season: JJA 2026: RONI +1.36, ONI +1.80
If 2026-27 is a strong El Niño winter, the eight past ones suggest:
pacific-northwest median 57% of usual; 7 of 8 strong winters below usual
northern-rockies median 80% of usual; 8 of 8 strong winters below usual
upper-midwest median 83% of usual; 6 of 8 strong winters below usual
great-lakes-ohio-valley median 78% of usual; 7 of 8 strong winters below usual
northeast median 92% of usual; 5 of 8 strong winters below usual
southern-plains median 184% of usual; 2 of 8 strong winters below usual
southwest median 139% of usual; 2 of 8 strong winters below usual
If 2026-27 is a strong winter, the past eight point to less snow than usual across the northern tier, most of all in the Pacific Northwest, and more in the southern Plains and Southwest. They do not say how much any one place will get: even where the tendency is strongest, individual winters vary, and eight is a small sample. NOAA's own winter outlook, which combines ENSO with other signals and models, is the forecast to read.
Pin and cite
verify checks every cached file against the lockfile's checksums. NCEI
rewrites station files weekly and CPC rewrites its tables monthly, so this
study's lockfile is committed and restored weekly, and its bytes are kept on
the mirror. The citations below are what a methods section needs, and
usdata cite dataset.yaml prints the same.
Show code
assert verify(manifest) == []
for citation in cite_lockfile(manifest):
    print(citation.as_text())
noaa:gsom-station-files
Lawrimore, Jay H.; Ray, Ron; Applequist, Scott; Korzeniewski, Bryant; Menne, Matthew J. (2016): Global Summary of the Month (GSOM), Version 1. NOAA National Centers for Environmental Information. https://doi.org/10.7289/V5QV3JJ5
homepage: https://www.ncei.noaa.gov/data/global-summary-of-the-month/
license: US Government Work (public domain)
terms: https://www.ncei.noaa.gov/metadata/geoportal/rest/metadata/item/gov.noaa.ncdc:C00946/html
retrieved: 2026-09-29; 315 checksummed assets (206,687,304 bytes) pinned by usdata 0.32.0
sources: pacific-northwest, northern-rockies, upper-midwest, great-lakes-ohio-valley, northeast, southern-plains, southwest
noaa:enso-indices
NOAA Climate Prediction Center, Relative Oceanic Niño Index and Oceanic Niño Index, accessed via usdata
homepage: https://www.cpc.ncep.noaa.gov/products/analysis_monitoring/enso/roni/
license: US Government Work (public domain)
terms: https://www.weather.gov/disclaimer
retrieved: 2026-09-29; 2 checksummed assets (37,720 bytes) pinned by usdata 0.32.0
sources: roni, oni
What was awkward
- Choosing stations needed NCEI's station list and inventory, which are not in the catalog, so the station rule was applied outside this notebook and only its result, the manifest, is pinned.
- The Access Data Service could not deliver 77 years at 315 stations: its requests stalled for minutes. The study uses whole station files instead, at about 200 MB for one element's worth of analysis.
- GSOM blanks a month with more than five missing days, and many cooperative stations have gaps: 157 of the 315 fell short of the completeness rule.
- The two ENSO indices disagree on 2023-24, and news about a "super El Niño" rarely says which index it means.
- Region boxes are rectangles in latitude and longitude, not climate divisions, and the southern boxes hold few stations with enough snow.