 usdata
The American Community Survey (ACS) is the Census Bureau's continuous household survey. Its 5-year estimates pool five years of responses, which is what lets them reach every county, however small. The detailed tables hold tens of thousands of variables per vintage, each estimate with a margin of error.
This walkthrough pulls the 2019-2023 estimates for Oklahoma's 77 counties:
population, housing units, and median household income, each with its margin
of error. It then looks at the fifteen counties where tornadoes touched down on
the evening of 6 May 2024, the ones the
disaster-declarations study
joins to FEMA's declarations. It needs usdata[pandas], matplotlib, and a
Census key.
The Census Data API requires a key on every data request. Set
USDATA_CENSUS_KEY in the environment first; the
ACS guide says how to
get one. No key reaches the manifest, the lockfile, the cached file, or any
output below.
This product uses the Census Bureau Data API but is not endorsed or certified by the Census Bureau.
from datetime import UTC, datetime
from pathlib import Path

import matplotlib.pyplot as plt
import pandas as pd

import usdata
from usdata import cite_lockfile, pull, verify

# One figure style for every usdata notebook, so previews look alike.
plt.rcParams.update(
    {
        "figure.figsize": (8, 4.5),
        "figure.dpi": 120,
        "axes.spines.top": False,
        "axes.spines.right": False,
        "axes.grid": True,
        "grid.alpha": 0.3,
        "font.size": 10,
    }
)
manifest = Path("dataset.yaml")
print("Executed (UTC):", datetime.now(UTC).isoformat(timespec="seconds"))
print(f"usdata {usdata.__version__}; pandas {pd.__version__}")
Executed (UTC): 2026-09-27T20:56:03+00:00
usdata 0.30.0; pandas 3.0.6
Select
The manifest names a vintage, the variables, and a place. vintage: 2023 is
the five-year period 2019 through 2023; a date window is refused, because a
five-year estimate is not an instant. The variables are API names: B01003
is total population, B25001 housing units, and B19013 median household
income, each as an estimate (_001E) and its margin of error (_001M).
location: Oklahoma with geography: county asks for one row per county in
the state, in one request.
print(manifest.read_text())name: oklahoma-counties-acs-2023
sources:
- name: counties
dataset: census:acs-5year
location: Oklahoma
variables: [NAME, B01003_001E, B01003_001M, B25001_001E, B25001_001M, B19013_001E, B19013_001M]
params:
vintage: 2023
geography: county
What arrives
One JSON file, as the service served it: a header row naming the columns, then
one row per county, every value a string. The response carries no copy of the
key and identical requests return identical bytes, so nothing is rewritten
before it is pinned. The vintage and the period it covers are not in the file,
so the asset records them as properties.
result = pull(manifest)
(item,) = result.fetched
print("File:", item.path.name)
print("Bytes:", item.provenance.size)
print("Checksum:", item.provenance.checksum)
print("Transformations:", item.provenance.transformations)
print("Credentials used:", item.provenance.credentials)
print("Properties:", item.asset.properties)
File: acs5_2023_40-counties_2a8ce0a8ecdf.json
Bytes: 6977
Checksum: sha256:5b0bd353b626ff745acaf5a66c8ba0d1a6142858bbc971ca424a560573ae1828
Transformations: []
Credentials used: ['USDATA_CENSUS_KEY']
Properties: {'vintage': '2023', 'period': '2019-2023'}
Open
The reader returns one row per county with the columns as the API names them.
Estimates and margins of error are numbers; NAME and the geography codes stay
text, so county keeps its leading zeros.
acs = item.open()
print(f"{len(acs)} counties")
print(acs.dtypes.to_string())
acs.head()
77 counties
NAME string
B01003_001E Int64
B01003_001M Int64
B25001_001E Int64
B25001_001M Int64
B19013_001E Int64
B19013_001M Int64
state string
county string
| NAME | B01003_001E | B01003_001M | B25001_001E | B25001_001M | B19013_001E | B19013_001M | state | county | |
|---|---|---|---|---|---|---|---|---|---|
| 0 | Adair County, Oklahoma | 19595 | -555555555 | 8123 | 37 | 48028 | 3543 | 40 | 001 |
| 1 | Alfalfa County, Oklahoma | 5685 | -555555555 | 2480 | 27 | 67870 | 6541 | 40 | 003 |
| 2 | Atoka County, Oklahoma | 14255 | -555555555 | 6015 | 38 | 52034 | 2895 | 40 | 005 |
| 3 | Beaver County, Oklahoma | 5041 | -555555555 | 2467 | 18 | 64266 | 5563 | 40 | 007 |
| 4 | Beckham County, Oklahoma | 22202 | -555555555 | 10120 | 67 | 52323 | 4425 | 40 | 009 |
Not every number is a measurement. The ACS writes a negative annotation code
where a value cannot be given, and the reader leaves those codes in place
because each means something different. Total population is controlled to the
Bureau's own population estimates, so it has no sampling error, and its margin
of error is -555555555 in every county.
numbers = acs.select_dtypes("number")
codes = {
    column: sorted({int(v) for v in numbers.loc[numbers[column] < 0, column]}) for column in numbers
}
print("Negative codes by column:", {column: found for column, found in codes.items() if found})
Negative codes by column: {'B01003_001M': [-555555555]}
A first look
A 5-year estimate reaches small counties, but it is less certain there. The margin of error on median household income, as a share of the estimate, against each county's population, with the counties that had a tornado that evening marked.
# The counties with tornado segments on 6 May 2024, as Storm Events writes their codes in the
# disaster-declarations study, padded to the three digits the ACS uses.
STORM_EVENTS_CODES = (1, 3, 11, 37, 47, 71, 73, 81, 93, 107, 109, 111, 113, 115, 147)
TORNADO = {f"{code:03}" for code in STORM_EVENTS_CODES}
income = acs[(acs.B19013_001E > 0) & (acs.B19013_001M > 0)].assign(
    relative_moe=lambda frame: 100 * frame.B19013_001M / frame.B19013_001E,
    tornado=lambda frame: frame.county.isin(TORNADO),
)
fig, ax = plt.subplots(layout="constrained")
for hit, group in income.groupby("tornado"):
    ax.scatter(
        group.B01003_001E,
        group.relative_moe,
        s=24,
        color="#b91c1c" if hit else "#94a3b8",
        label="Tornado on 6 May 2024" if hit else "Other counties",
        zorder=3 if hit else 2,
    )
ax.set_xscale("log")
ax.set_xlabel("Population, 2019-2023 estimate (log scale)")
ax.set_ylabel("Margin of error, % of estimate")
ax.set_title("Oklahoma counties: median household income is less certain in small counties")
ax.legend(frameon=False)
plt.show()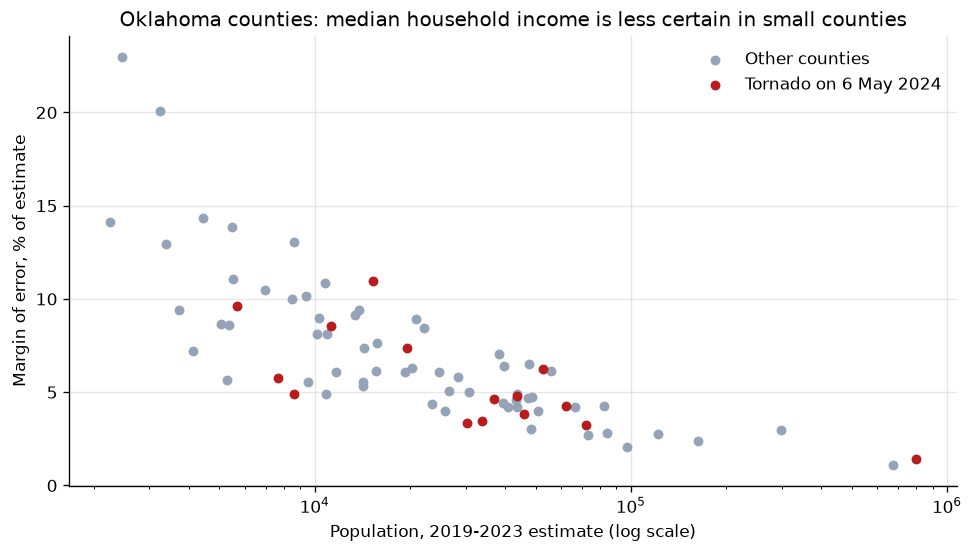
hit = acs[acs.county.isin(TORNADO)].sort_values("B01003_001E", ascending=False)
print(f"{len(hit)} counties with a tornado segment that evening")
print(f"Population: {hit.B01003_001E.sum():,}; housing units: {hit.B25001_001E.sum():,}")
hit[["NAME", "B01003_001E", "B25001_001E", "B25001_001M", "B19013_001E", "B19013_001M"]].rename(
    columns={
        "B01003_001E": "population",
        "B25001_001E": "housing units",
        "B25001_001M": "± housing",
        "B19013_001E": "median income ($)",
        "B19013_001M": "± income",
    }
)
15 counties with a tornado segment that evening
Population: 1,247,081; housing units: 555,665
| NAME | population | housing units | ± housing | median income ($) | ± income | |
|---|---|---|---|---|---|---|
| 54 | Oklahoma County, Oklahoma | 800487 | 356997 | 371 | 65374 | 926 |
| 18 | Creek County, Oklahoma | 72353 | 31387 | 91 | 61849 | 2008 |
| 23 | Garfield County, Oklahoma | 62322 | 27782 | 84 | 67302 | 2878 |
| 73 | Washington County, Oklahoma | 52895 | 23745 | 41 | 61205 | 3814 |
| 56 | Osage County, Oklahoma | 45963 | 19801 | 59 | 60482 | 2318 |
| 35 | Kay County, Oklahoma | 43731 | 20923 | 111 | 56673 | 2707 |
| 55 | Okmulgee County, Oklahoma | 36922 | 16708 | 44 | 53123 | 2469 |
| 40 | Lincoln County, Oklahoma | 33917 | 14516 | 82 | 59425 | 2046 |
| 57 | Ottawa County, Oklahoma | 30360 | 13695 | 138 | 48656 | 1641 |
| 0 | Adair County, Oklahoma | 19595 | 8123 | 37 | 48028 | 3543 |
| 36 | Kingfisher County, Oklahoma | 15288 | 6426 | 28 | 70617 | 7733 |
| 53 | Okfuskee County, Oklahoma | 11304 | 4779 | 82 | 45441 | 3894 |
| 5 | Blaine County, Oklahoma | 8603 | 4590 | 119 | 59304 | 2919 |
| 46 | Major County, Oklahoma | 7656 | 3713 | 24 | 69229 | 3990 |
| 1 | Alfalfa County, Oklahoma | 5685 | 2480 | 27 | 67870 | 6541 |
Housing units are counted closely: their margins are a few percent of the estimate at most. Median income is less certain, and its margins run several times wider in the smaller counties. Summing the populations is sound, since each is a controlled count; a margin of error for a sum of estimates is not the sum of their margins, and the Census Bureau documents how to approximate one.
Pin and cite
verify checks the cached file against the lockfile's checksum without a
key. The response has no revision date, so a table the Bureau reissues shows up
as drift on a later pull, and pull --update accepts it deliberately.
assert verify(manifest) == []
for citation in cite_lockfile(manifest):
    print(citation.as_text())
census:acs-5year
U.S. Census Bureau, American Community Survey 5-Year Estimates, Detailed Tables, Census Data API, accessed via usdata
homepage: https://www.census.gov/data/developers/data-sets/acs-5year.html
license: US Government Work (public domain)
terms: https://www.census.gov/data/developers/about/terms-of-service.html
retrieved: 2026-09-27; 1 checksummed asset (6,977 bytes) pinned by usdata 0.30.0
sources: counties
What was awkward
- The annotation codes arrive as ordinary numbers.
B01003_001Mis-555555555in every county, and a sum or mean over a margin column is nonsense until the codes are masked; nothing in the frame flags them. - Finding a variable's name means reading the API's variable list for the
vintage, outside usdata;
usdata infolists only the handful in the catalog entry. - Joining to Storm Events needs care with county codes: Storm Events writes
1where the ACS writes001. - The table does not say which five years it covers; the asset's
propertiesdo, and a copy of the file without its sidecar loses that.