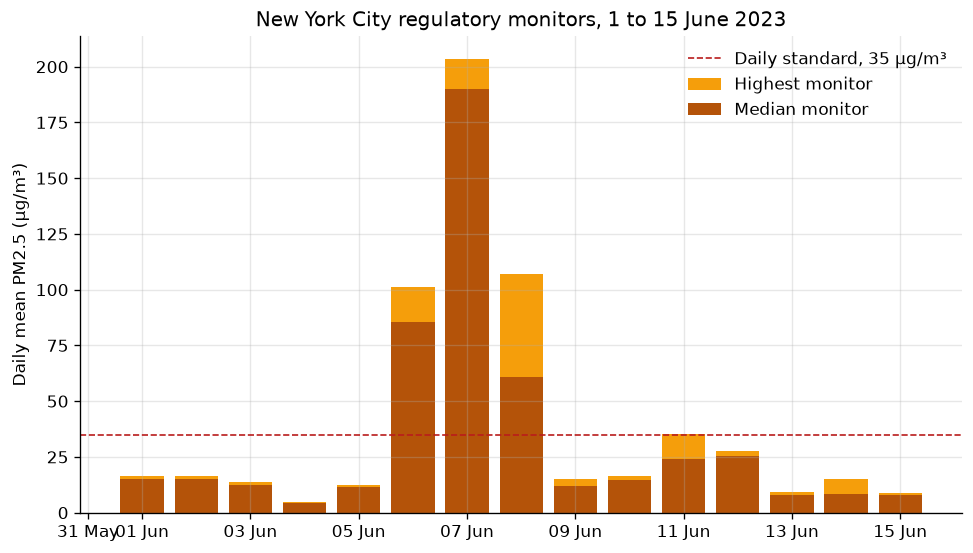
usdata
EPA's Air Quality System (AQS) is the archive of regulatory air monitoring:
state, local, and tribal agencies submit, validate, and certify it. The
dailyData service returns one JSON document per request, with a row per
monitor, local day, and pollutant standard: the day's mean and maximum, the
hour of the maximum, the AQI where the standard defines one, and how
complete the day was.
This walkthrough pulls every daily PM2.5 summary for 2023 from one monitoring
site, Queens College in New York City, where Canadian wildfire smoke arrived
in June. It needs usdata[pandas], matplotlib, and an AQS key; the one
request takes one to two minutes.
AQS requires a registered email and key in every request. Set
USDATA_AQS_EMAIL and USDATA_AQS_KEY in the environment first; the
AQS guide says how to get
them. No key reaches the manifest, the lockfile, the cached file, or any
output below.
from datetime import UTC, datetime
from pathlib import Path

import matplotlib.pyplot as plt
import pandas as pd

import usdata
from usdata import cite_lockfile, pull, verify

# One figure style for every usdata notebook, so previews look alike.
plt.rcParams.update(
    {
        "figure.figsize": (8, 4.5),
        "figure.dpi": 120,
        "axes.spines.top": False,
        "axes.spines.right": False,
        "axes.grid": True,
        "grid.alpha": 0.3,
        "font.size": 10,
    }
)
manifest = Path("dataset.yaml")
print("Executed (UTC):", datetime.now(UTC).isoformat(timespec="seconds"))
print(f"usdata {usdata.__version__}; pandas {pd.__version__}")
Executed (UTC): 2026-09-24T05:55:41+00:00
usdata 0.26.0; pandas 3.0.6
Select
The manifest names one parameter code, one site, and a window. 88101 is
PM2.5 measured at local conditions; 36-081-0124 is state 36 (New York),
county 081 (Queens), site 0124 (Queens College). The service refuses a
request that spans two calendar years, so usdata makes one request, and
writes one file, per year the window touches: here, one.
print(manifest.read_text())name: queens-college-pm25-2023
sources:
- name: pm25
dataset: epa:aqs-daily
start: 2023-01-01
end: 2023-12-31
params:
parameters: 88101
sites: 36-081-0124
What arrives
One JSON file. It is not the bytes as sent: AQS echoes the whole request,
key included, in its header, and its row order and request_time change
between identical requests. usdata writes a canonical form instead, the
header without url and request_time, rows in a fixed order, keys sorted,
and records that step in the provenance, so a checksum can pin it.
result = pull(manifest)
(item,) = result.fetched
print("File:", item.path.name)
print("Bytes:", item.provenance.size)
print("Retrieved (UTC):", item.provenance.retrieved_at.isoformat(timespec="seconds"))
print("Checksum:", item.provenance.checksum)
print("Transformations:", item.provenance.transformations)
print("Credentials used:", item.provenance.credentials)
File: aqs-daily_site-36-081-0124_88101_20230101_20231231.json
Bytes: 5529304
Retrieved (UTC): 2026-09-24T05:55:56+00:00
Checksum: sha256:4a26cfcb1a5596f8670413455fc31ff03337b128775741f864875cede0fe0c08
Transformations: ['aqs canonical json: Header url and request_time removed; Data sorted by site, parameter, poc, local date, duration, standard, method, and event type']
Credentials used: ['USDATA_AQS_EMAIL', 'USDATA_AQS_KEY']
Open
The reader returns one row per element of the service's Data list, with the
columns as AQS names them. date_local is a day in the monitor's local
standard time, parsed as a naive date. Several rows describe one monitor on
one day: once per pollutant standard the day is compared with, once more for
the hourly series, and again when an agency flagged an exceptional event.
pm25 = item.open()
print(f"{len(pm25)} rows, {pm25.date_local.min():%Y-%m-%d} to {pm25.date_local.max():%Y-%m-%d}")
pm25.groupby(["pollutant_standard", "sample_duration", "event_type"], dropna=False).size().rename(
    "rows"
).to_frame()
6161 rows, 2023-01-01 to 2023-12-31
| rows | |||
|---|---|---|---|
| pollutant_standard | sample_duration | event_type | |
| PM25 24-hour 1997 | 24 HOUR | No Events | 119 |
| 24-HR BLK AVG | Events Included | 194 | |
| No Events | 363 | ||
| PM25 24-hour 2006 | 24 HOUR | No Events | 119 |
| 24-HR BLK AVG | Events Included | 194 | |
| No Events | 363 | ||
| PM25 24-hour 2012 | 24 HOUR | No Events | 119 |
| 24-HR BLK AVG | Events Included | 194 | |
| No Events | 363 | ||
| PM25 24-hour 2024 | 24 HOUR | No Events | 119 |
| 24-HR BLK AVG | Events Included | 194 | |
| No Events | 363 | ||
| PM25 Annual 1997 | 24 HOUR | No Events | 119 |
| 24-HR BLK AVG | Events Included | 194 | |
| No Events | 363 | ||
| PM25 Annual 2006 | 24 HOUR | No Events | 119 |
| 24-HR BLK AVG | Events Included | 194 | |
| No Events | 363 | ||
| PM25 Annual 2012 | 24 HOUR | No Events | 119 |
| 24-HR BLK AVG | Events Included | 194 | |
| No Events | 363 | ||
| PM25 Annual 2024 | 24 HOUR | No Events | 119 |
| 24-HR BLK AVG | Events Included | 194 | |
| No Events | 363 | ||
| NaN | 1 HOUR | Concurred Events Excluded | 194 |
| Events Included | 194 | ||
| No Events | 365 |
To count days, keep one row per monitor and day: the current daily standard,
PM25 24-hour 2024, and the rows that describe what was measured
(No Events and Events Included), not the ones with flagged days removed.
daily = pm25[
    (pm25.pollutant_standard == "PM25 24-hour 2024")
    & ~pm25.event_type.isin(["Events Excluded", "Concurred Events Excluded"])
]
assert not daily.duplicated(["poc", "date_local"]).any()
print(f"{len(daily)} monitor-days from {daily.poc.nunique()} instruments (POC)")
daily[["date_local", "poc", "sample_duration", "arithmetic_mean", "aqi", "event_type"]].head()
676 monitor-days from 3 instruments (POC)
| date_local | poc | sample_duration | arithmetic_mean | aqi | event_type | |
|---|---|---|---|---|---|---|
| 3 | 2023-01-03 | 1 | 24 HOUR | 16.9 | 66.0 | No Events |
| 11 | 2023-01-06 | 1 | 24 HOUR | 5.0 | 28.0 | No Events |
| 19 | 2023-01-09 | 1 | 24 HOUR | 8.3 | 46.0 | No Events |
| 27 | 2023-01-12 | 1 | 24 HOUR | 5.9 | 33.0 | No Events |
| 35 | 2023-01-15 | 1 | 24 HOUR | 3.0 | 17.0 | No Events |
A first look
A year of daily means from each instrument at the site, against the 35 µg/m³ daily standard.
fig, ax = plt.subplots(layout="constrained")
for poc, series in daily.sort_values("date_local").groupby("poc"):
    ax.plot(series.date_local, series.arithmetic_mean, linewidth=1, label=f"POC {poc}")
ax.axhline(35, color="#b91c1c", linewidth=1, linestyle="--", label="Daily standard, 35 µg/m³")
ax.set_ylabel("Daily mean PM2.5 (µg/m³)")
ax.set_title("Queens College, New York City: daily PM2.5 in 2023")
ax.legend(frameon=False)
plt.show()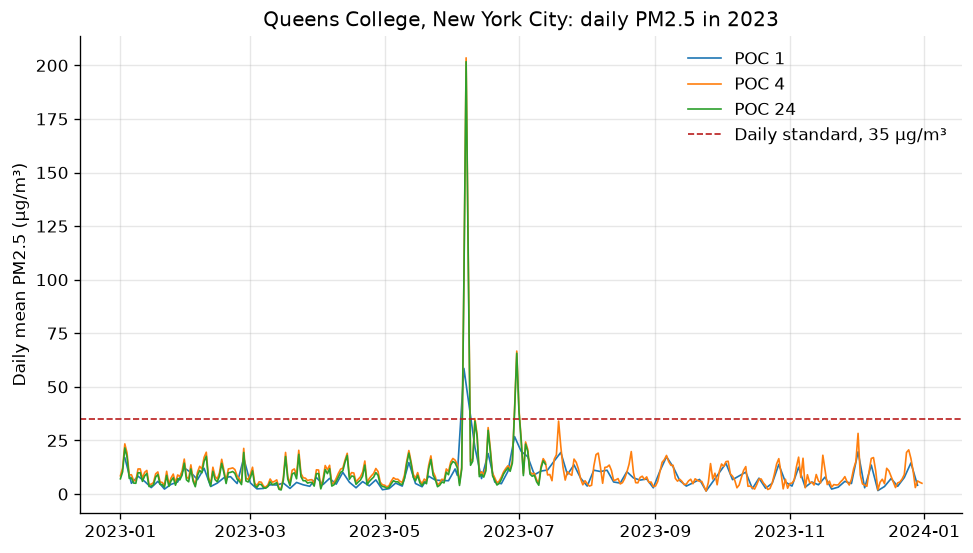
peak = daily.loc[daily.arithmetic_mean.idxmax()]
over = daily[daily.arithmetic_mean > 35]
print(f"Highest daily mean: {peak.arithmetic_mean:.1f} µg/m³ on {peak.date_local:%d %B}")
print(f"Its AQI: {peak.aqi:.0f}")
print(f"Days above 35 µg/m³ at any instrument: {over.date_local.dt.date.nunique()}")
print("Those days:", ", ".join(f"{day:%d %b}" for day in sorted(set(over.date_local))))
Highest daily mean: 203.5 µg/m³ on 07 June
Its AQI: 278
Days above 35 µg/m³ at any instrument: 7
Those days: 06 Jun, 07 Jun, 08 Jun, 11 Jun, 29 Jun, 30 Jun, 01 Jul
The year sits well under the standard apart from two episodes, 6 to 11 June and 29 June to 1 July, when smoke from Canadian wildfires reached the city. The wildfire-smoke study follows those days across every monitor in the city.
Pin and cite
verify checks the cached file against the lockfile's checksum without a
key. Agencies revise AQS data, and each row carries date_of_last_change,
so a later pull can report drift; pull --update accepts a revision
deliberately.
assert verify(manifest) == []
print("Latest revision in the file:", f"{pm25.date_of_last_change.max():%Y-%m-%d}")
for citation in cite_lockfile(manifest):
    print(citation.as_text())
Latest revision in the file: 2024-06-17
epa:aqs-daily
U.S. Environmental Protection Agency, Air Quality System (AQS) daily summary data, AQS Data API, accessed via usdata
homepage: https://aqs.epa.gov/aqsweb/documents/data_api.html#daily
license: US Government Work (public domain)
terms: https://aqs.epa.gov/aqsweb/documents/data_api.html#terms
retrieved: 2026-09-24; 1 checksummed asset (5,529,304 bytes) pinned by usdata 0.26.0
sources: pm25
What was awkward
- One monitor-day is up to nine rows: eight PM2.5 standards plus the hourly series. Counting rows above 35 µg/m³ counts most days several times; filtering to one standard is the fix, and nothing in the file says to.
- Exceptional events are not flagged by day. A monitor with any flagged event
gets an
Events Includedcopy of its rows, so filtering on the event type decides whether smoke days are in or out of the count. - A mistyped parameter code returns the same "No data matched your selection" as a real code with no monitors, and arrives as a file with no rows.
- It is slow: a site-year is one request that takes a minute or two, and EPA asks for pauses between requests, which the adapter enforces.