 usdata
In the first week of June 2023, smoke from wildfires in Quebec drifted south over New York City and turned the sky orange. This study reads EPA's daily PM2.5 summaries from the regulatory monitors in and around the city for 1 to 15 June, keeps one row per monitor and day, and counts how far above the daily standard of 35 µg/m³ the smoke days went.
It needs usdata[pandas], matplotlib, and either an AQS key
(USDATA_AQS_EMAIL and USDATA_AQS_KEY; the
AQS guide says how) or
the committed lockfile and the project mirror: with
USDATA_MIRROR_URL=https://data.usdata.dev, pull restores the pinned file
without asking EPA and says that upstream was not checked.
Show code
from datetime import UTC, datetime
from pathlib import Path

import matplotlib.pyplot as plt
import pandas as pd

import usdata
from usdata import cite_lockfile, pull, verify

# One figure style for every usdata notebook, so previews look alike.
plt.rcParams.update(
    {
        "figure.figsize": (8, 4.5),
        "figure.dpi": 120,
        "axes.spines.top": False,
        "axes.spines.right": False,
        "axes.grid": True,
        "grid.alpha": 0.3,
        "font.size": 10,
    }
)
manifest = Path("dataset.yaml")
print("Executed (UTC):", datetime.now(UTC).isoformat(timespec="seconds"))
print(f"usdata {usdata.__version__}; pandas {pd.__version__}")
Executed (UTC): 2026-09-24T05:57:42+00:00
usdata 0.26.0; pandas 3.0.6
Data
One source: AQS daily summaries for parameter 88101, PM2.5 at local conditions, from every monitor inside a box around the five boroughs, 1 to 15 June 2023. A box rather than a county, because the city is five counties. The lockfile beside the manifest pins the file this study read.
Show code
print(manifest.read_text())
pm25 = pull(manifest).one("pm25").open()
sites = pm25.site_number.nunique()
print(f"{len(pm25)} rows from {sites} sites in states {sorted(pm25.state_code.unique())}")
name: nyc-wildfire-smoke
sources:
- name: pm25
dataset: epa:aqs-daily
# The five boroughs and their edges. A box, not a county: New York City is five counties.
bbox: {west: -74.26, south: 40.49, east: -73.70, north: 40.92}
start: 2023-06-01
end: 2023-06-15
params:
parameters: 88101
1790 rows from 13 sites in states ['34', '36']
One row per monitor and day
AQS writes a monitor-day up to nine times: once for each PM2.5 standard it
is compared with, and once for the hourly series with no standard. A monitor
with any flagged exceptional event also gets Events Included and
Concurred Events Excluded copies. Three filters leave one row each:
New York State only (the box takes in New Jersey), the current daily
standard, and the rows that describe what was measured rather than the ones
with flagged days removed.
Show code
print(pm25.pollutant_standard.fillna("none").value_counts().to_string())
print()
print(pm25.event_type.value_counts().to_string())
pollutant_standard
PM25 24-hour 1997 202
PM25 24-hour 2006 202
PM25 24-hour 2012 202
PM25 24-hour 2024 202
PM25 Annual 1997 202
PM25 Annual 2006 202
PM25 Annual 2012 202
PM25 Annual 2024 202
none 174
event_type
No Events 1172
Events Included 453
Concurred Events Excluded 165
Show code
daily = pm25[
    (pm25.state_code == "36")
    & (pm25.pollutant_standard == "PM25 24-hour 2024")
    & ~pm25.event_type.isin(["Events Excluded", "Concurred Events Excluded"])
]
assert not daily.duplicated(["county_code", "site_number", "poc", "date_local"]).any()
daily = daily.assign(
    monitor=daily.county_code + "-" + daily.site_number + "/" + daily.poc.astype(str)
)
monitors, sites = daily.monitor.nunique(), daily.site_number.nunique()
print(f"{len(daily)} monitor-days from {monitors} monitors at {sites} sites")
sorted(set(zip(daily.county, daily.local_site_name, strict=True)))
95 monitor-days from 13 monitors at 8 sites
[('Bronx', 'IS 52'),
 ('Bronx', 'PFIZER LAB SITE'),
 ('Kings', 'JHS 126'),
 ('New York', 'IS 45'),
 ('New York', 'PS 19'),
 ('Queens', 'QUEENS COLLEGE 2'),
 ('Queens', 'Queens College Near Road'),
 ('Richmond', 'RICHMOND POST OFFICE')]
The fortnight, day by day
Show code
by_day = daily.groupby(daily.date_local.dt.date).agg(
    monitors=("monitor", "nunique"),
    median=("arithmetic_mean", "median"),
    highest=("arithmetic_mean", "max"),
    above_standard=("arithmetic_mean", lambda values: int((values > 35).sum())),
)
by_day.round(1)| monitors | median | highest | above_standard | |
|---|---|---|---|---|
| date_local | ||||
| 2023-06-01 | 4 | 15.2 | 16.6 | 0 |
| 2023-06-02 | 10 | 15.0 | 16.6 | 0 |
| 2023-06-03 | 5 | 12.2 | 13.8 | 0 |
| 2023-06-04 | 4 | 4.4 | 5.0 | 0 |
| 2023-06-05 | 11 | 11.5 | 12.5 | 0 |
| 2023-06-06 | 5 | 85.6 | 101.0 | 5 |
| 2023-06-07 | 4 | 190.0 | 203.5 | 4 |
| 2023-06-08 | 9 | 61.0 | 106.9 | 9 |
| 2023-06-09 | 4 | 12.1 | 15.1 | 0 |
| 2023-06-10 | 4 | 14.7 | 16.5 | 0 |
| 2023-06-11 | 13 | 24.2 | 35.2 | 1 |
| 2023-06-12 | 4 | 25.2 | 27.8 | 0 |
| 2023-06-13 | 4 | 8.0 | 9.2 | 0 |
| 2023-06-14 | 10 | 8.5 | 14.9 | 0 |
| 2023-06-15 | 4 | 8.1 | 9.0 | 0 |
Show code
days = pd.to_datetime(by_day.index)
fig, ax = plt.subplots(layout="constrained")
ax.bar(days, by_day["highest"], color="#f59e0b", label="Highest monitor")
ax.bar(days, by_day["median"], color="#b45309", label="Median monitor")
ax.axhline(35, color="#b91c1c", linewidth=1, linestyle="--", label="Daily standard, 35 µg/m³")
ax.set_ylabel("Daily mean PM2.5 (µg/m³)")
ax.set_title("New York City regulatory monitors, 1 to 15 June 2023")
ax.xaxis.set_major_formatter(plt.matplotlib.dates.DateFormatter("%d %b"))
ax.legend(frameon=False)
plt.show()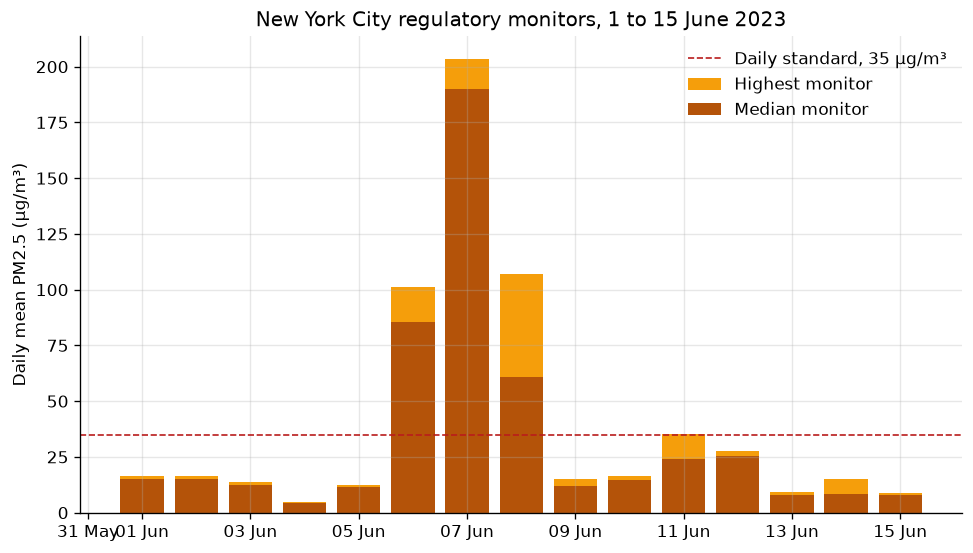
Show code
peak = daily.loc[daily.arithmetic_mean.idxmax()]
print(
    f"Highest daily mean: {peak.arithmetic_mean:.1f} µg/m³ at {peak.local_site_name} "
    f"({peak.county}) on {peak.date_local:%d %B}"
)
print(f"That is {peak.arithmetic_mean / 35:.1f} times the standard; AQI {peak.aqi:.0f}")
smoke = by_day.loc[by_day.above_standard > 0]
print("Days with any monitor above 35 µg/m³:", ", ".join(f"{day:%d %b}" for day in smoke.index))
Highest daily mean: 203.5 µg/m³ at QUEENS COLLEGE 2 (Queens) on 07 June
That is 5.8 times the standard; AQI 278
Days with any monitor above 35 µg/m³: 06 Jun, 07 Jun, 08 Jun, 11 Jun
Findings
Every New York monitor that reported on 6, 7, and 8 June was above the daily standard. The highest daily mean was at Queens College on 7 June, nearly six times the standard, in the AQI's "Very Unhealthy" band. The rest of the fortnight stayed below it apart from one monitor just over the line on 11 June.
This is a statement about daily means at regulatory monitors, not about exposure: a daily mean hides the afternoon peak, and a handful of sites stands in for a city of eight million. The count of reporting monitors also varies by day, because filter-based samplers report on their own schedules.
AQS is revised when agencies correct data, and each row carries
date_of_last_change, so this pin can drift; a later pull reports it and
pull --update accepts it.
Show code
print("Latest revision in the pinned file:", f"{pm25.date_of_last_change.max():%Y-%m-%d}")Latest revision in the pinned file: 2025-09-23
Pin and cite
Show code
assert verify(manifest) == []
for citation in cite_lockfile(manifest):
    print(citation.as_text())
epa:aqs-daily
U.S. Environmental Protection Agency, Air Quality System (AQS) daily summary data, AQS Data API, accessed via usdata
homepage: https://aqs.epa.gov/aqsweb/documents/data_api.html#daily
license: US Government Work (public domain)
terms: https://aqs.epa.gov/aqsweb/documents/data_api.html#terms
retrieved: 2026-09-24; 1 checksummed asset (1,583,231 bytes) pinned by usdata 0.25.0
sources: pm25
What was awkward
- The box took in New Jersey. Fort Lee, Jersey City, Union City, Paterson,
and Elizabeth sit inside any rectangle drawn around the five boroughs.
state_code == "36"keeps New York, which inside this box is exactly the city. Naming the five boroughs as fivelocationsources would select each county exactly, at five slow requests instead of one. - One monitor-day is up to nine rows. Counting rows above 35 µg/m³ would count most monitors eight or nine times; filtering to one standard is the whole fix, but nothing in the file says to do it.
- Exceptional events are not flagged by day. A monitor with any flagged
event gets an
Events Includedcopy of every row, so all fifteen days carry event rows, not only the smoke days. - The first live pull asked for nothing. httpx replaces a URL's whole query
when given
params=, so adding the key that way threw away the box and the dates; EPA's refusal came back in the response header, and the adapter now reports it instead of a bare 400. - It is slow: requests took one to two minutes each, and EPA asks for a pause between them, which the adapter enforces.