usdata
NOAA's Center for Operational Oceanographic Products and Services (CO-OPS) predicts the astronomical tide at its stations from each station's harmonic constituents: the amplitudes and phases of the tidal periods fitted to years of that station's observed water levels. The CO-OPS Data API computes the predictions on request, for one station, one vertical datum, and up to a year, on a six-minute or other fixed step or as the times and heights of high and low water. One request returns one CSV.
This walkthrough pulls the predicted high and low waters at The Battery, New
York, for May 2024. It needs usdata[pandas] and matplotlib, and downloads
one 3 kB file in a second or two.
from datetime import UTC, datetime
from pathlib import Path

import matplotlib.dates as mdates
import matplotlib.pyplot as plt
import pandas as pd

import usdata
from usdata import cite_lockfile, pull, verify

# One figure style for every usdata notebook, so previews look alike.
plt.rcParams.update(
    {
        "figure.figsize": (8, 4.5),
        "figure.dpi": 120,
        "axes.spines.top": False,
        "axes.spines.right": False,
        "axes.grid": True,
        "grid.alpha": 0.3,
        "font.size": 10,
    }
)
manifest = Path("dataset.yaml")
print("Executed (UTC):", datetime.now(UTC).isoformat(timespec="seconds"))
print(f"usdata {usdata.__version__}; pandas {pd.__version__}")
Executed (UTC): 2026-09-24T06:03:43+00:00
usdata 0.26.0; pandas 3.0.6
Select
The manifest names one station by its seven-digit ID (8518750 is The
Battery), the vertical datum, the units, the interval, and a window. MLLW
is mean lower low water, so zero is an ordinary low tide; units: metric
asks for metres. interval: hilo returns only the predicted high and low
waters. The default, 6, returns a height every six minutes, which lines up
row for row with the observed water levels
requested on the same station, datum, and window.
Both bounds are inclusive and in UTC, and a bare date as the end means 23:59 on that day, so these dates select all of May. One source covers at most 366 days.
print(manifest.read_text())name: battery-tide-predictions
sources:
- dataset: noaa:coops-tide-predictions
start: 2024-05-01
end: 2024-05-31
params:
station: "8518750"
datum: MLLW
units: metric
interval: hilo
What arrives
The first pull downloads one CSV and writes dataset.lock.json beside the
manifest, pinning the file's checksum. The source URL is the only place the
request's station, datum, units, interval, and time zone are recorded.
result = pull(manifest)
(item,) = result.fetched
print("File:", item.path.name)
print("Bytes:", item.provenance.size)
print("Source:", item.provenance.source_url)
print("Retrieved (UTC):", item.provenance.retrieved_at.isoformat(timespec="seconds"))
print("Checksum:", item.provenance.checksum)
File: predictions_8518750_fc146504aa50b033.csv
Bytes: 2996
Source: https://api.tidesandcurrents.noaa.gov/api/prod/datagetter?station=8518750&product=predictions&begin_date=20240501+00%3A00&end_date=20240531+23%3A59&datum=MLLW&units=metric&interval=hilo&time_zone=gmt&format=csv&application=usdata
Retrieved (UTC): 2026-09-24T06:03:44+00:00
Checksum: sha256:d4be2e04d5b311113d5e6249b236b3c599a83f3c6019c384800fec7d57530402
Open
The generic CSV reader returns NOAA's column names with their leading spaces;
strip them locally. Date Time is text in UTC with no offset, Prediction
is metres above MLLW, and Type is H or L, a column only the hilo
interval has. Predictions are computed, not measured, so there are no
quality flags and no gaps.
frame = item.open().rename(columns=str.strip)
frame["Date Time"] = pd.to_datetime(frame["Date Time"], utc=True)
print(f"{len(frame)} rows, {frame['Date Time'].min()} to {frame['Date Time'].max()}")
print("Type:", frame["Type"].value_counts().to_dict())
frame.head()
119 rows, 2024-05-01 06:07:00+00:00 to 2024-05-31 19:41:00+00:00
Type: {'H': 60, 'L': 59}
| Date Time | Prediction | Type | |
|---|---|---|---|
| 0 | 2024-05-01 06:07:00+00:00 | 1.455 | H |
| 1 | 2024-05-01 13:09:00+00:00 | 0.164 | L |
| 2 | 2024-05-01 18:57:00+00:00 | 1.256 | H |
| 3 | 2024-05-02 01:23:00+00:00 | 0.290 | L |
| 4 | 2024-05-02 07:12:00+00:00 | 1.450 | H |
A first look
Every predicted high and low water of the month. The vertical lines mark the new moon (8 May, 03:22 UTC) and the full moon (23 May, 13:53 UTC).
highs = frame[frame["Type"] == "H"]
lows = frame[frame["Type"] == "L"]
fig, ax = plt.subplots(layout="constrained")
for rows, color, label in [(highs, "#2563a6", "High water"), (lows, "#b45631", "Low water")]:
    ax.plot(rows["Date Time"], rows["Prediction"], "o-", ms=3, lw=1, color=color, label=label)
for moon, label in [("2024-05-08 03:22", "New moon"), ("2024-05-23 13:53", "Full moon")]:
    when = pd.Timestamp(moon, tz="UTC")
    ax.axvline(when, color="black", lw=1, ls="--")
    ax.annotate(label, (when, 2.05), xytext=(4, 0), textcoords="offset points")
ax.axhline(0, color="black", lw=0.8)
ax.set_ylim(-0.4, 2.2)
ax.xaxis.set_major_locator(mdates.DayLocator(bymonthday=[1, 8, 15, 22, 29]))
ax.xaxis.set_major_formatter(mdates.DateFormatter("%d %b"))
ax.set_xlabel("May 2024 (UTC)")
ax.set_ylabel("Predicted height above MLLW (m)")
ax.set_title("The Battery, New York: predicted high and low waters")
ax.legend(loc="center", frameon=False, ncols=2)
plt.show()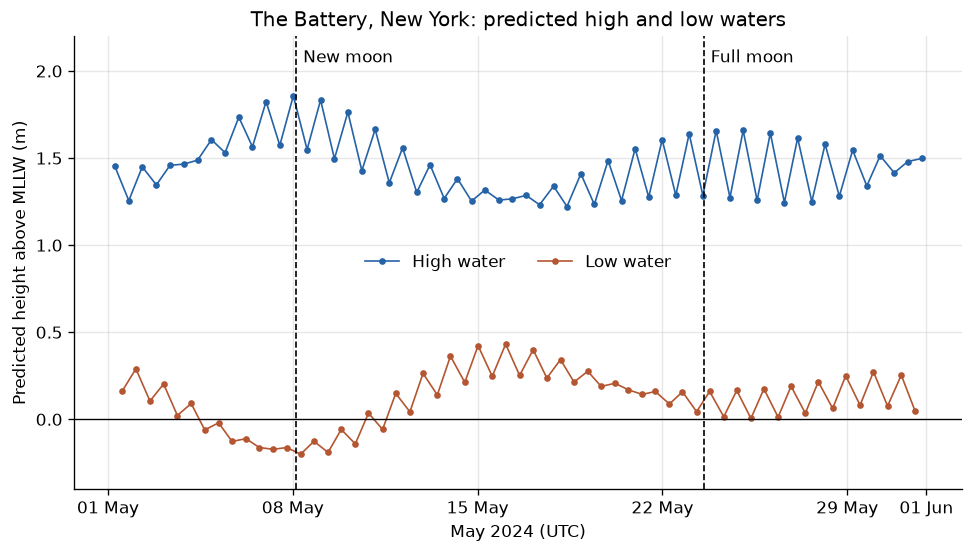
# The range of each tide: every change from one extreme to the next.
ranges = frame["Prediction"].diff().abs().set_axis(frame["Date Time"]).dropna()
top, bottom = frame.loc[highs["Prediction"].idxmax()], frame.loc[lows["Prediction"].idxmin()]
print(f"Highest high water: {top['Prediction']:.3f} m at {top['Date Time']:%d %b %H:%M} UTC")
print(f"Lowest low water: {bottom['Prediction']:.3f} m at {bottom['Date Time']:%d %b %H:%M} UTC")
print(f"Largest range: {ranges.max():.2f} m, ending {ranges.idxmax():%d %b %H:%M} UTC")
print(f"Smallest range: {ranges.min():.2f} m, ending {ranges.idxmin():%d %b %H:%M} UTC")
Highest high water: 1.858 m at 08 May 00:31 UTC
Lowest low water: -0.200 m at 08 May 07:14 UTC
Largest range: 2.06 m, ending 08 May 07:14 UTC
Smallest range: 0.83 m, ending 16 May 01:32 UTC
The range swells and shrinks twice in the month: largest near the new and full moons (spring tides), smallest between them (neap tides), from 2.06 m between the high and low water of 8 May down to 0.83 m on 16 May. The two springs are not equal. The 8 May new moon came within days of the Moon's closest approach of the month, and both the highest high and the lowest low water fell that day. The zigzag in each line is the daily inequality: one of the day's two high waters stands above the other, by as much as 0.4 m in late May.
The prediction for 00:31 UTC on 8 May was 1.858 m; the observed water level that night peaked at 2.06 m. Observation minus prediction is the non-tidal residual, which the storm surge study measures during Hurricane Helene.
Pin and cite
verify checks the cached file against the lockfile's checksum. Keep the
manifest and lockfile with your analysis; the citation below is what a
methods section needs, and usdata cite dataset.yaml prints the same.
assert verify(manifest) == []
for citation in cite_lockfile(manifest):
    print(citation.as_text())
noaa:coops-tide-predictions
NOAA National Ocean Service, Center for Operational Oceanographic Products and Services, tide predictions, accessed via usdata
homepage: https://api.tidesandcurrents.noaa.gov/api/prod/
license: US Government Work (public domain)
terms: https://tidesandcurrents.noaa.gov/disclaimers.html
retrieved: 2026-09-24; 1 checksummed asset (2,996 bytes) pinned by usdata 0.26.0
sources: 1
What was awkward
- NOAA's column names keep their leading spaces (
" Prediction"), so the columns have to be stripped before use. - The CSV carries no station, datum, units, or interval. They are recorded only in the source URL, so the manifest has to travel with the data.
- The columns depend on the interval:
Typeexists only withhilo, so code written for six-minute predictions breaks on high/low ones and the reverse. - Predictions are computed on request from constituents NOAA revises now and then, so the same request can later return different bytes. The lockfile records what this run received.
- Subordinate stations serve only
hilo; other intervals fail at fetch time rather than when the manifest is checked.