usdata
NOAA's Center for Operational Oceanographic Products and Services (CO-OPS) runs the National Water Level Observation Network, about 200 long-term tide stations on U.S. coasts and the Great Lakes. Each station reports its water level every six minutes, and the CO-OPS Data API serves those observations, preliminary at first and verified about a month later. One request returns one CSV for one station, one vertical datum, and at most 28 days.
This walkthrough pulls three days of six-minute observations at The Battery,
at the southern tip of Manhattan, from 6 to 8 May 2024. It needs
usdata[pandas] and matplotlib, and downloads one 28 kB file in a second or
two.
from datetime import UTC, datetime
from pathlib import Path

import matplotlib.dates as mdates
import matplotlib.pyplot as plt
import pandas as pd

import usdata
from usdata import cite_lockfile, pull, verify

# One figure style for every usdata notebook, so previews look alike.
plt.rcParams.update(
    {
        "figure.figsize": (8, 4.5),
        "figure.dpi": 120,
        "axes.spines.top": False,
        "axes.spines.right": False,
        "axes.grid": True,
        "grid.alpha": 0.3,
        "font.size": 10,
    }
)
manifest = Path("dataset.yaml")
print("Executed (UTC):", datetime.now(UTC).isoformat(timespec="seconds"))
print(f"usdata {usdata.__version__}; pandas {pd.__version__}")
Executed (UTC): 2026-09-24T05:56:24+00:00
usdata 0.26.0; pandas 3.0.6
Select
The manifest names one station by its seven-digit ID (8518750 is The
Battery), the vertical datum the heights are measured from, the units, and a
window. MLLW is mean lower low water, the station's average of each day's
lower low tide over the 1983 to 2001 National Tidal Datum Epoch, so a height
of zero is an ordinary low tide and negative heights are lower than usual. A
different datum moves every value by a constant; it does not change the
shape of the curve. units: metric asks for metres.
Both bounds are inclusive and in UTC. A bare date as the end means 23:59 on that day, so these two dates select three whole days: 720 six-minute readings.
print(manifest.read_text())name: coastal-water-levels
sources:
- dataset: noaa:coops-water-levels
start: 2024-05-06
end: 2024-05-08
params:
station: "8518750"
datum: MLLW
units: metric
What arrives
The first pull downloads one CSV and writes dataset.lock.json beside the
manifest, pinning the file's checksum. The source URL is the only place the
request's station, datum, units, and time zone are recorded.
result = pull(manifest)
(item,) = result.fetched
print("File:", item.path.name)
print("Bytes:", item.provenance.size)
print("Source:", item.provenance.source_url)
print("Retrieved (UTC):", item.provenance.retrieved_at.isoformat(timespec="seconds"))
print("Checksum:", item.provenance.checksum)
File: water_level_8518750_7559e70250be8e23.csv
Bytes: 27986
Source: https://api.tidesandcurrents.noaa.gov/api/prod/datagetter?station=8518750&product=water_level&begin_date=20240506+00%3A00&end_date=20240508+23%3A59&datum=MLLW&units=metric&time_zone=gmt&format=csv&application=usdata
Retrieved (UTC): 2026-09-24T05:56:24+00:00
Checksum: sha256:64799305cdaa292ed8272dfa9a9477702382cd412d2eff153c65160e934f108b
Open
The generic CSV reader returns a DataFrame with NOAA's column names as
written, leading spaces included (" Water Level", " Quality "). Stripping
them locally makes the columns easier to use and does not touch the cached
bytes. Date Time is text in UTC with no offset, because the request fixes
time_zone=gmt; parsing it with utc=True makes that explicit.
Water Level is metres above MLLW and Sigma the standard deviation of the
one-second samples behind each six-minute value. Quality is p for
preliminary or v for verified, and the four flag columns mean different
things in each state: on verified data the first is I, set when NOAA
inferred the value, and on preliminary data it is O, a count of outlying
samples. F, R, and L are set when a value exceeded the flat, rate of
change, or expected height tolerance.
frame = item.open().rename(columns=str.strip)
frame["Date Time"] = pd.to_datetime(frame["Date Time"], utc=True)
flags = ["O or I (for verified)", "F", "R", "L"]
print(f"{len(frame)} rows, {frame['Date Time'].min()} to {frame['Date Time'].max()}")
print("Quality:", frame["Quality"].value_counts().to_dict())
print("Rows with each flag set:", frame[flags].sum().to_dict())
frame.head()
720 rows, 2024-05-06 00:00:00+00:00 to 2024-05-08 23:54:00+00:00
Quality: {'v': 720}
Rows with each flag set: {'O or I (for verified)': 0, 'F': 0, 'R': 0, 'L': 40}
| Date Time | Water Level | Sigma | O or I (for verified) | F | R | L | Quality | |
|---|---|---|---|---|---|---|---|---|
| 0 | 2024-05-06 00:00:00+00:00 | 1.765 | 0.060 | 0 | 0 | 0 | 0 | v |
| 1 | 2024-05-06 00:06:00+00:00 | 1.730 | 0.040 | 0 | 0 | 0 | 0 | v |
| 2 | 2024-05-06 00:12:00+00:00 | 1.702 | 0.065 | 0 | 0 | 0 | 0 | v |
| 3 | 2024-05-06 00:18:00+00:00 | 1.677 | 0.065 | 0 | 0 | 0 | 0 | v |
| 4 | 2024-05-06 00:24:00+00:00 | 1.642 | 0.124 | 0 | 0 | 0 | 0 | v |
A first look
Three days of water level against the datum, with the readings NOAA flagged as beyond its expected height limit drawn in orange.
limit = frame["L"] == 1
fig, ax = plt.subplots(layout="constrained")
ax.plot(frame["Date Time"], frame["Water Level"], color="#2563a6", linewidth=1.5)
ax.scatter(
    frame.loc[limit, "Date Time"],
    frame.loc[limit, "Water Level"],
    color="#b45631",
    s=10,
    zorder=3,
    label="Expected height limit exceeded (L = 1)",
)
ax.axhline(0, color="black", linewidth=1)
ax.set_ylabel("Water level above MLLW (m)")
ax.set_ylim(-0.3, 2.5)
ax.xaxis.set_major_formatter(mdates.DateFormatter("%d %b %H:%M"))
ax.set_xlabel("Time (UTC), May 2024")
ax.set_title("The Battery, New York: six-minute observed water level")
ax.legend(loc="upper left", frameon=False)
plt.show()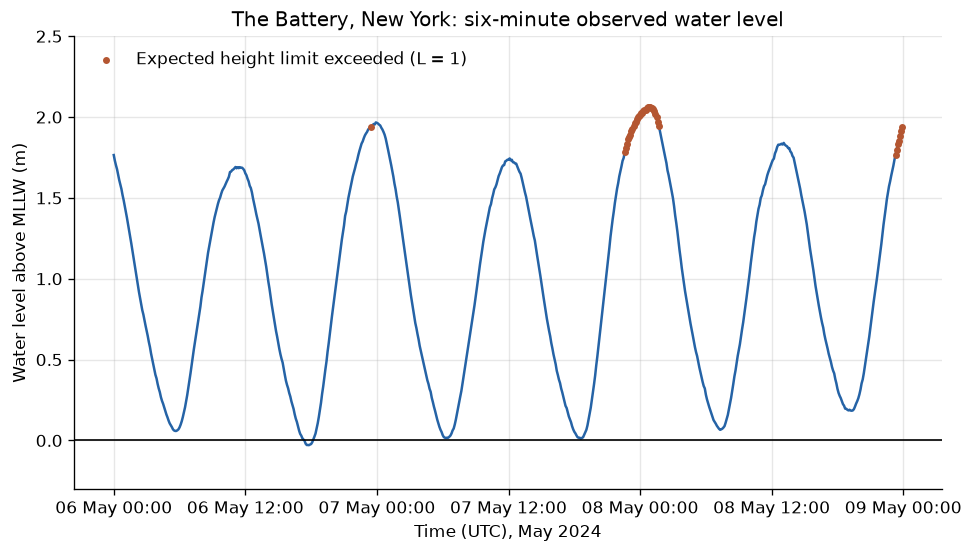
level = frame.set_index("Date Time")["Water Level"]
# A high water is the highest reading within three hours either side of it.
highs = level[level == level.rolling(61, center=True).max()]
highs = highs[highs.index.to_series().diff().fillna(pd.Timedelta("1D")) > pd.Timedelta("1h")]
print("High waters (m above MLLW):")
print(highs.to_string())
print(f"Lowest reading: {level.min():.3f} m at {level.idxmin():%d %b %H:%M} UTC")
first, last = level[limit.values].index[[0, -1]]
print(f"Flagged L: {limit.sum()} readings, {first:%d %b %H:%M} to {last:%d %b %H:%M} UTC")
High waters (m above MLLW):
Date Time
2024-05-06 11:06:00+00:00 1.691
2024-05-06 23:54:00+00:00 1.967
2024-05-07 12:06:00+00:00 1.744
2024-05-08 00:42:00+00:00 2.060
2024-05-08 13:06:00+00:00 1.840
Lowest reading: -0.029 m at 06 May 17:48 UTC
Flagged L: 40 readings, 06 May 23:30 to 08 May 23:54 UTC
The Battery has two high and two low tides a day, and they are not equal: the
high water near midnight UTC stood about 0.3 m above the one near noon. The
highest water, 2.06 m from 00:42 to 00:54 UTC on 8 May, came a few hours
before the new moon, when tides run largest. The readings flagged L sit on
the peaks near midnight UTC: the flag records that a verified value passed
NOAA's expected height limit, not that the value was rejected.
Pin and cite
verify checks the cached file against the lockfile's checksum. Keep the
manifest and lockfile with your analysis; the citation below is what a
methods section needs, and usdata cite dataset.yaml prints the same.
assert verify(manifest) == []
for citation in cite_lockfile(manifest):
    print(citation.as_text())
noaa:coops-water-levels
NOAA National Ocean Service, Center for Operational Oceanographic Products and Services, observed water levels, accessed via usdata
homepage: https://api.tidesandcurrents.noaa.gov/api/prod/
license: US Government Work (public domain)
terms: https://tidesandcurrents.noaa.gov/disclaimers.html
retrieved: 2026-09-24; 1 checksummed asset (27,986 bytes) pinned by usdata 0.26.0
sources: 1
What was awkward
- NOAA's column names keep their leading and trailing spaces (
" Quality "), soframe["Quality"]fails until the columns are stripped. - The CSV carries no station, datum, units, or time zone. They are recorded only in the source URL, so the manifest and provenance have to travel with the data.
- The flag columns change meaning with
Quality: the first is an outlier count on preliminary data and an inference flag on verified data, under the one headerO or I (for verified). Read the response definitions before filtering on any flag. - One source covers at most 28 days. A longer record has to be declared as several sources in the manifest; the adapter does not split it.
- A window with no data fails at fetch time: NOAA answers with an HTTP 200
no-data message, which usdata raises as an upstream error, and
allow_emptydoes not suppress it. - Tide predictions are a separate dataset. Comparing observed with predicted water, as the storm surge study does, takes a second source from CO-OPS tide predictions.