usdata
Local Climatological Data (LCD) is NOAA's record of the weather reports issued at U.S. airports and other first-order stations: the routine hourly METAR, special reports when conditions change between hours, synoptic reports, and the daily and monthly summaries NCEI derives from them. NCEI publishes it through its Access Data Service, and one request returns one CSV with a row per report.
This walkthrough pulls three days, 6 to 8 May 2024, at Will Rogers World
Airport in Oklahoma City: hourly temperature and precipitation beside each
day's summary maximum, minimum, and precipitation. The evening of 6 May
brought thunderstorms to central Oklahoma. It needs usdata[pandas] and
matplotlib, downloads about 12 kB, and runs in a few seconds.
from datetime import UTC, datetime
from pathlib import Path

import matplotlib.pyplot as plt
import pandas as pd

import usdata
from usdata import cite_lockfile, pull, verify

# One figure style for every usdata notebook, so previews look alike.
plt.rcParams.update(
    {
        "figure.figsize": (8, 4.5),
        "figure.dpi": 120,
        "axes.spines.top": False,
        "axes.spines.right": False,
        "axes.grid": True,
        "grid.alpha": 0.3,
        "font.size": 10,
    }
)
manifest = Path("dataset.yaml")
print("Executed (UTC):", datetime.now(UTC).isoformat(timespec="seconds"))
print(f"usdata {usdata.__version__}; pandas {pd.__version__}")
Executed (UTC): 2026-09-24T06:00:35+00:00
usdata 0.26.0; pandas 3.0.6
Select
The manifest names one station, five columns, and three whole calendar days.
LCD station ids are eleven digits, a five-digit WMO index followed by the
six-digit WBAN number: 72353013967 is the airport. The GHCN id
USW00013967 or the bare WBAN 13967 are accepted by the service but return
no rows, so a bbox or place query is the reliable way to find an id.
Without variables, every row carries 125 columns. units: metric asks for
degrees Celsius and millimetres.
print(manifest.read_text())name: okc-hourly-observations
sources:
- dataset: noaa:lcd
start: 2024-05-06
end: 2024-05-08
variables:
- HourlyDryBulbTemperature
- HourlyPrecipitation
- DailyMaximumDryBulbTemperature
- DailyMinimumDryBulbTemperature
- DailyPrecipitation
params:
stations: "72353013967"
units: metric
What arrives
The first pull downloads one CSV and writes dataset.lock.json beside the
manifest, pinning the file's checksum. NCEI revises LCD as reports pass
quality control, so a later pull of the same days can return different
bytes; the lockfile records which ones this analysis used.
result = pull(manifest)
(item,) = result.fetched
print("File:", item.path.name)
print("Bytes:", item.provenance.size)
print("Source:", item.provenance.source_url)
print("Retrieved (UTC):", item.provenance.retrieved_at.isoformat(timespec="seconds"))
print("Checksum:", item.provenance.checksum)
File: local-climatological-data_2024-05-06_2024-05-08_0a46d27282eb.csv
Bytes: 11955
Source: https://www.ncei.noaa.gov/access/services/data/v1?dataset=local-climatological-data&stations=72353013967&startDate=2024-05-06&endDate=2024-05-08&format=csv&units=metric&includeStationLocation=1&dataTypes=HourlyDryBulbTemperature%2CHourlyPrecipitation%2CDailyMaximumDryBulbTemperature%2CDailyMinimumDryBulbTemperature%2CDailyPrecipitation
Retrieved (UTC): 2026-09-24T06:00:35+00:00
Checksum: sha256:b00d871956217f95d3c992f77cc5735229e4c6bc002ec6a11c4ceecfbd92c2e4
Open
The generic CSV reader returns a DataFrame with one row per report. DATE is
the station's local standard time with no offset, UTC-6 at Oklahoma City all
year, with no daylight saving shift: it is not a UTC instant. REPORT_TYPE
says what each row is, and carries trailing spaces. The hourly columns are
filled on observation reports and the daily columns only on the SOD
summary row. HourlyPrecipitation arrives as text because a trace is T.
frame = item.open_csv(parse_dates=["DATE"])
frame["REPORT_TYPE"] = frame["REPORT_TYPE"].str.strip()
print(f"{len(frame)} reports, {frame['DATE'].min()} to {frame['DATE'].max()} local standard time")
print(frame["REPORT_TYPE"].value_counts().to_string())
frame[["DATE", "REPORT_TYPE", "HourlyDryBulbTemperature", "HourlyPrecipitation"]].head(6)
125 reports, 2024-05-06 00:00:00 to 2024-05-08 23:59:00 local standard time
REPORT_TYPE
FM-15 72
FM-16 31
FM-12 19
SOD 3
| DATE | REPORT_TYPE | HourlyDryBulbTemperature | HourlyPrecipitation | |
|---|---|---|---|---|
| 0 | 2024-05-06 00:00:00 | FM-12 | 16.1 | NaN |
| 1 | 2024-05-06 00:52:00 | FM-15 | 16.1 | 0.00 |
| 2 | 2024-05-06 01:19:00 | FM-16 | 15.6 | NaN |
| 3 | 2024-05-06 01:52:00 | FM-15 | 15.6 | 0.00 |
| 4 | 2024-05-06 02:52:00 | FM-15 | 16.1 | 0.00 |
| 5 | 2024-05-06 03:00:00 | FM-12 | 16.1 | NaN |
The report types here are routine hourly METARs (FM-15, issued at 52
minutes past each hour at this station), specials (FM-16), synoptic reports
(FM-12), and the summary of the day (SOD), stamped 23:59.
hourly = frame[frame["REPORT_TYPE"] == "FM-15"].copy()
special = frame[frame["REPORT_TYPE"] == "FM-16"]
summary = frame[frame["REPORT_TYPE"] == "SOD"]
summary = summary.set_index(summary["DATE"].dt.date.rename("DAY"))
hourly["PRECIP_MM"] = pd.to_numeric(hourly["HourlyPrecipitation"].replace("T", "0"))
summary[["DailyMaximumDryBulbTemperature", "DailyMinimumDryBulbTemperature", "DailyPrecipitation"]]| DailyMaximumDryBulbTemperature | DailyMinimumDryBulbTemperature | DailyPrecipitation | |
|---|---|---|---|
| DAY | |||
| 2024-05-06 | 27.2 | 15.6 | 10.92 |
| 2024-05-07 | 26.7 | 11.7 | 0.00 |
| 2024-05-08 | 26.7 | 17.2 | 0.00 |
A first look
Three days of temperature, with the special reports between the hours and each day's summary maximum and minimum, above the hourly precipitation.
fig, (warm, wet) = plt.subplots(
    2, 1, sharex=True, layout="constrained", gridspec_kw={"height_ratios": [3, 1]}
)
warm.plot(
    hourly["DATE"], hourly["HourlyDryBulbTemperature"], color="#b45631", label="Hourly (FM-15)"
)
warm.scatter(
    special["DATE"],
    special["HourlyDryBulbTemperature"],
    color="black",
    s=10,
    zorder=3,
    label="Special (FM-16)",
)
for day, row in summary.iterrows():
    start = pd.Timestamp(day)
    end = start + pd.Timedelta(days=1)
    for column in ["DailyMaximumDryBulbTemperature", "DailyMinimumDryBulbTemperature"]:
        warm.hlines(row[column], start, end, color="#2f6f8f", linestyle="--", linewidth=1)
warm.plot([], [], color="#2f6f8f", linestyle="--", linewidth=1, label="Daily summary max and min")
warm.set_ylabel("Temperature (°C)")
warm.set_title("Will Rogers World Airport, Oklahoma City: 6 to 8 May 2024")
warm.legend(loc="lower right", fontsize=8, frameon=False)
wet.bar(hourly["DATE"], hourly["PRECIP_MM"], width=pd.Timedelta(minutes=50), color="#2563a6")
wet.set_ylabel("Precip. (mm/h)")
wet.set_xlabel("Local standard time (UTC-6)")
plt.show()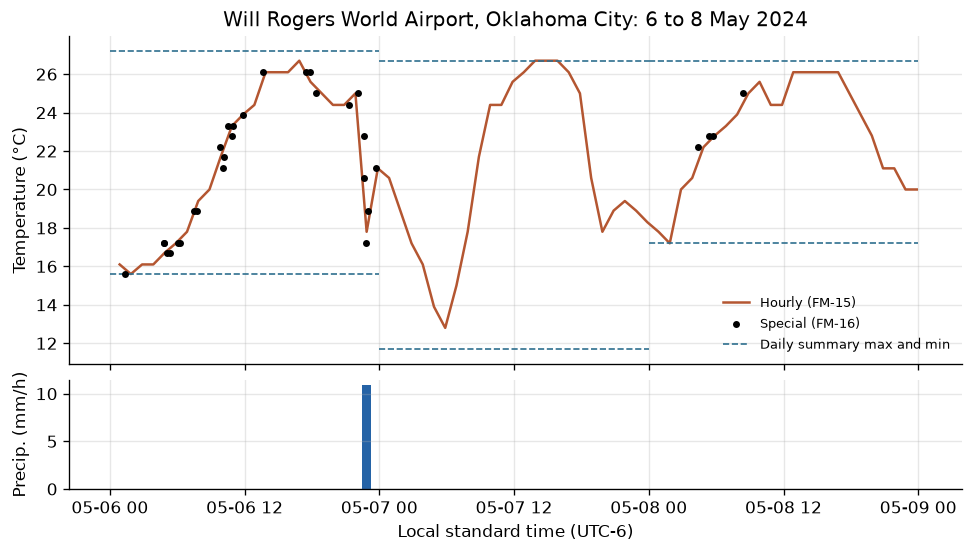
check = hourly.groupby(hourly["DATE"].dt.date).agg(
    HOURLY_MAX=("HourlyDryBulbTemperature", "max"),
    HOURLY_MIN=("HourlyDryBulbTemperature", "min"),
    HOURLY_PRECIP=("PRECIP_MM", "sum"),
)
check = check.join(
    summary[
        ["DailyMaximumDryBulbTemperature", "DailyMinimumDryBulbTemperature", "DailyPrecipitation"]
    ]
)
storm = special[(special["DATE"] >= "2024-05-06 22:00") & (special["DATE"] < "2024-05-07")]
print(check.to_string())
print()
print(storm[["DATE", "HourlyDryBulbTemperature", "HourlyPrecipitation"]].to_string(index=False))
HOURLY_MAX HOURLY_MIN HOURLY_PRECIP DailyMaximumDryBulbTemperature DailyMinimumDryBulbTemperature DailyPrecipitation
DATE
2024-05-06 26.7 15.6 10.92 27.2 15.6 10.92
2024-05-07 26.7 12.8 0.00 26.7 11.7 0.00
2024-05-08 26.1 17.2 0.00 26.7 17.2 0.00
DATE HourlyDryBulbTemperature HourlyPrecipitation
2024-05-06 22:04:00 25.0 NaN
2024-05-06 22:38:00 22.8 1.52
2024-05-06 22:40:00 20.6 2.79
2024-05-06 22:50:00 17.2 NaN
2024-05-06 22:58:00 18.9 0.51
2024-05-06 23:42:00 21.1 0.51
The storm on the evening of 6 May shows in the specials: the temperature fell 7.8 °C, from 25.0 °C at 22:04 to 17.2 °C at 22:50, between two hourly reports, and the day's whole 10.92 mm arrived in the hourly report at 22:52. The summary's extremes are not the hourly ones: NCEI takes them from every report and the station's continuous sensor, so the 6 May maximum is 0.5 °C above the highest hourly reading and the 7 May minimum 1.1 °C below the lowest. Summing hourly precipitation, with a trace as zero, reproduces each day's total.
Pin and cite
verify checks the cached file against the lockfile's checksum. Because NCEI
revises LCD, keep the cache with the manifest and lockfile; a checksum cannot
recreate bytes upstream has replaced. usdata cite dataset.yaml prints the
same citation.
assert verify(manifest) == []
for citation in cite_lockfile(manifest):
    print(citation.as_text())
noaa:lcd
NOAA National Centers for Environmental Information, U.S. Local Climatological Data, accessed via usdata
homepage: https://www.ncei.noaa.gov/products/land-based-station/local-climatological-data
license: US Government Work (public domain)
terms: https://www.ncei.noaa.gov/metadata/geoportal/rest/metadata/item/gov.noaa.ncdc:C00684/html
retrieved: 2026-09-24; 1 checksummed asset (11,955 bytes) pinned by usdata 0.26.0
sources: 1
What was awkward
DATEis local standard time with no offset. Parsing it gives naive timestamps that look like UTC or local clock time and are neither; joining with UTC data needs an explicit+6 hhere, and the offset differs by station.- Every report type shares one table. Aggregating without filtering on
REPORT_TYPEmixes hourly, special, and synoptic reports and the daily summary row, andREPORT_TYPEneeds.str.strip()before comparing. - Precipitation is text because a trace is
T, and values elsewhere can carry quality suffixes such ass, so numeric columns need an explicit coercion that decides what a trace is worth. - The obvious station ids (
USW00013967,13967) return a header and no rows rather than an error. - The CSV carries no units; the manifest's
units: metricis the only record of them. The LCD guide links NCEI's documentation for each column's unit.