 usdata
Compare one day's routine temperature reports at Will Rogers World Airport with the airport's 1991–2020 hourly temperature normals. The calculation matches each report to the nearest hourly normal, reports what was excluded or unmatched, and then restores both pinned files into an empty cache. It describes one station and one day, not statistical rarity or a climate trend.
This study needs usdata[pandas] and matplotlib. It downloads two small CSVs
and runs in a few seconds.
Show code
from datetime import UTC, datetime
from pathlib import Path
from tempfile import TemporaryDirectory

import matplotlib.dates as mdates
import matplotlib.pyplot as plt
import pandas as pd

import usdata
from usdata import cite_lockfile, pull, verify

# One figure style for every usdata notebook, so previews look alike.
plt.rcParams.update(
    {
        "figure.figsize": (8, 4.5),
        "figure.dpi": 120,
        "axes.spines.top": False,
        "axes.spines.right": False,
        "axes.grid": True,
        "grid.alpha": 0.3,
        "font.size": 10,
    }
)
manifest = Path("dataset.yaml")
print("Executed (UTC):", datetime.now(UTC).isoformat(timespec="seconds"))
print(f"usdata {usdata.__version__}; pandas {pd.__version__}")
Executed (UTC): 2026-09-24T06:00:00+00:00
usdata 0.26.0; pandas 3.0.6
Data
One manifest names two sources for the same airport, both in metric units:
- Local Climatological Data (LCD),
named
observations: every report filed on 6 May 2024 at station72353013967, of which the routine hourly readings are the observations. - Climate normals, named
normals, withperiod: hourly: the 1991–2020 hourly mean temperature at stationUSW00013967. The request covers 6 and 7 May, because the day's last report matches the next midnight's normal.
Show code
print(manifest.read_text())name: okc-hourly-anomalies
sources:
- name: observations
dataset: noaa:lcd
start: 2024-05-06
end: 2024-05-06
variables: [HourlyDryBulbTemperature]
params:
stations: "72353013967"
units: metric
- name: normals
dataset: noaa:climate-normals
start: 2024-05-06
end: 2024-05-07
variables: [HLY-TEMP-NORMAL]
params:
stations: USW00013967
period: hourly
units: metric
Show code
result = pull(manifest)
observations = result.one("observations").open_csv(dtype={"DATE": "string"})
normals = result.one("normals").open_csv(dtype={"DATE": "string"})
print(f"Fetched {len(observations)} LCD reports and {len(normals)} hourly normals.")
print(f"Lockfile pins {len(result.lockfile.assets)} assets.")
print()
for item in result.fetched:
    print(item.asset.dataset_id)
    print(f"Bytes: {item.provenance.size}; cache hit: {item.from_cache}")
    print("Source:", item.provenance.source_url)
    print("Retrieved (UTC):", item.provenance.retrieved_at.isoformat(timespec="seconds"))
    print("Checksum:", item.provenance.checksum)
    print()
Fetched 60 LCD reports and 48 hourly normals.
Lockfile pins 2 assets.
noaa:lcd
Bytes: 5256; cache hit: False
Source: https://www.ncei.noaa.gov/access/services/data/v1?dataset=local-climatological-data&stations=72353013967&startDate=2024-05-06&endDate=2024-05-06&format=csv&units=metric&includeStationLocation=1&dataTypes=HourlyDryBulbTemperature
Retrieved (UTC): 2026-09-24T06:00:01+00:00
Checksum: sha256:8de03b216a814c25277f172c935082818893393e9731951007d5ea15613b972f
noaa:climate-normals
Bytes: 3430; cache hit: False
Source: https://www.ncei.noaa.gov/access/services/data/v1?dataset=normals-hourly-1991-2020&stations=USW00013967&format=csv&units=metric&includeStationLocation=1&startDate=2020-05-06&endDate=2020-05-07&dataTypes=HLY-TEMP-NORMAL
Retrieved (UTC): 2026-09-24T06:00:01+00:00
Checksum: sha256:8a57959c59bf2a9df81fec170f9d4678d666c9d909826bbbba5d67f6e618bad6
Align the station and the clock
LCD uses 72353013967; normals use USW00013967 for this airport. Both date
columns label local standard time (CST here, UTC−6 throughout the year).
Do not localize them to a daylight-saving time zone: May civil time would
shift the comparison by an hour.
Keep routine hourly METAR reports (FM-15), not specials or daily summaries.
The reports occur at :52; match each to the nearest normal within ten
minutes. This is an explicit approximation, not an hourly observed mean. The
comparison keeps the actual report times and counts invalid or unmatched rows.
The normals' yearless labels are mapped onto 2024 only for this comparison. NOAA's hourly documentation describes local standard time, missing values, and the 15-day windows pooled over 30 years. There are no February 29 normals.
Show code
assert set(observations["STATION"]) == {"72353013967"}
assert set(normals["STATION"]) == {"USW00013967"}
reports = observations.loc[observations["REPORT_TYPE"].str.strip().eq("FM-15")].copy()
reports["observed_at"] = pd.to_datetime(reports["DATE"], format="%Y-%m-%dT%H:%M:%S")
# Flagged strings stay invalid; do not silently strip quality suffixes.
reports["observed_c"] = pd.to_numeric(reports["HourlyDryBulbTemperature"], errors="coerce")
reports["observed_c"] = reports["observed_c"].mask(reports["observed_c"].eq(-9999))
normals["normal_at"] = pd.to_datetime("2024-" + normals["DATE"], format="%Y-%m-%dT%H:%M:%S")
normals["normal_c"] = pd.to_numeric(normals["HLY-TEMP-NORMAL"], errors="coerce")
normals["normal_c"] = normals["normal_c"].mask(normals["normal_c"].eq(-9999))
assert not normals["normal_at"].duplicated().any()
comparison = pd.merge_asof(
    reports[["observed_at", "observed_c"]].sort_values("observed_at"),
    normals[["normal_at", "normal_c"]].sort_values("normal_at"),
    left_on="observed_at",
    right_on="normal_at",
    direction="nearest",
    tolerance=pd.Timedelta(minutes=10),
)
comparison["departure_c"] = comparison["observed_c"] - comparison["normal_c"]
comparison["offset_minutes"] = (
    comparison["normal_at"] - comparison["observed_at"]
).dt.total_seconds() / 60
usable = comparison.dropna(subset=["departure_c"])
assert len(usable) > 0, "No usable matched temperatures; inspect the source tables."
print(f"Routine reports: {len(reports)}; other report types: {len(observations) - len(reports)}")
print(f"Invalid observations: {comparison.observed_c.isna().sum()}")
print(f"Invalid normals: {normals.normal_c.isna().sum()}")
print(f"Unmatched reports: {comparison.normal_at.isna().sum()}; usable pairs: {len(usable)}")
comparison.tail()
Routine reports: 24; other report types: 36
Invalid observations: 0
Invalid normals: 0
Unmatched reports: 0; usable pairs: 24
| observed_at | observed_c | normal_at | normal_c | departure_c | offset_minutes | |
|---|---|---|---|---|---|---|
| 19 | 2024-05-06 19:52:00 | 24.4 | 2024-05-06 20:00:00 | 19.1 | 5.3 | 8.0 |
| 20 | 2024-05-06 20:52:00 | 24.4 | 2024-05-06 21:00:00 | 18.2 | 6.2 | 8.0 |
| 21 | 2024-05-06 21:52:00 | 25.0 | 2024-05-06 22:00:00 | 17.5 | 7.5 | 8.0 |
| 22 | 2024-05-06 22:52:00 | 17.8 | 2024-05-06 23:00:00 | 16.8 | 1.0 | 8.0 |
| 23 | 2024-05-06 23:52:00 | 21.1 | 2024-05-07 00:00:00 | 16.3 | 4.8 | 8.0 |
Temperature departures
HLY-TEMP-NORMAL and HourlyDryBulbTemperature are requested in metric
units. The hourly normal's conversion was checked against standard-unit
responses for this station before the study was written; that check does not
establish the units of every other normals variable.
A positive departure means warmer than the matched hourly mean. It does not establish a percentile, a trend, or statistical rarity. These are individual reports compared with calendar normals, not daily means.
Show code
fig, (temps, departures) = plt.subplots(2, 1, sharex=True, layout="constrained")
temps.plot(
    usable["observed_at"],
    usable["observed_c"],
    marker=".",
    color="#b45631",
    label="Routine observation",
)
temps.plot(
    usable["observed_at"],
    usable["normal_c"],
    color="#2563a6",
    label="Nearest hourly normal (within 10 min)",
)
temps.set_ylabel("Temperature (°C)")
temps.set_title("Will Rogers World Airport, Oklahoma City, 6 May 2024")
temps.legend(loc="upper left", frameon=False)
departures.bar(usable["observed_at"], usable["departure_c"], width=0.03, color="#b45631")
departures.axhline(0, color="#444444", linewidth=0.8)
departures.set_ylabel("Departure (°C)")
departures.set_xlabel("Report time, local standard time (CST, UTC-6)")
departures.xaxis.set_major_formatter(mdates.DateFormatter("%H:%M"))
plt.show()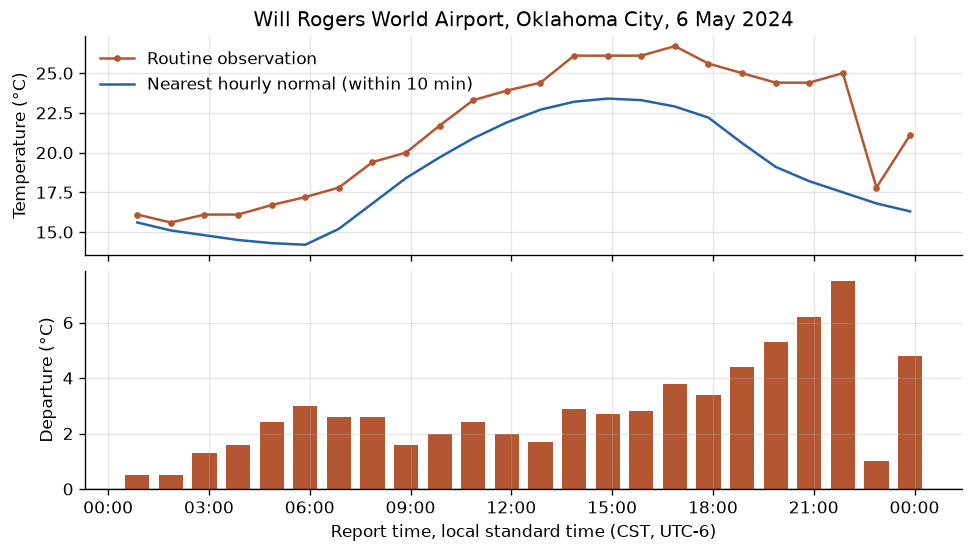
Show code
warm = usable["departure_c"].gt(0).sum()
peak = usable.loc[usable["departure_c"].idxmax()]
print(f"{warm} of {len(usable)} usable reports were warmer than the matched normal.")
print(f"Mean departure across matched reports: {usable.departure_c.mean():.2f} C")
print(f"Largest warm departure: {peak.departure_c:.1f} C at {peak.observed_at:%Y-%m-%d %H:%M} CST")
print(
    f"Matched normal: {peak.normal_at:%Y-%m-%d %H:%M} CST ({peak.offset_minutes:.0f} minutes later)"
)
24 of 24 usable reports were warmer than the matched normal.
Mean departure across matched reports: 2.88 C
Largest warm departure: 7.5 C at 2024-05-06 21:52 CST
Matched normal: 2024-05-06 22:00 CST (8 minutes later)
Pin and cite
verify checks the cached bytes against the lockfile. Restoring the same
lockfile into an empty temporary cache and comparing every file proves exact
restoration at the time of execution, not perpetual upstream availability.
NCEI can revise both query responses; keep the manifest, lockfile, and cached
bytes together, and review a later mismatch before accepting an update. The
citations below are what a methods section needs, and
usdata cite dataset.yaml prints the same.
Show code
assert verify(manifest) == []
with TemporaryDirectory(prefix="usdata-hourly-restore-") as fresh:
    restored = pull(manifest, root=fresh)
    assert restored.from_lockfile
    assert all(not item.from_cache for item in restored.fetched)
    assert restored.lockfile == result.lockfile
    assert verify(manifest, root=fresh) == []
    for name in ("observations", "normals"):
        assert restored.one(name).path.read_bytes() == result.one(name).path.read_bytes()
print("Both inputs restored byte-for-byte into an empty cache and passed verification.")
print()
for citation in cite_lockfile(manifest):
    print(citation.as_text())
Both inputs restored byte-for-byte into an empty cache and passed verification.
noaa:lcd
NOAA National Centers for Environmental Information, U.S. Local Climatological Data, accessed via usdata
homepage: https://www.ncei.noaa.gov/products/land-based-station/local-climatological-data
license: US Government Work (public domain)
terms: https://www.ncei.noaa.gov/metadata/geoportal/rest/metadata/item/gov.noaa.ncdc:C00684/html
retrieved: 2026-09-24; 1 checksummed asset (5,256 bytes) pinned by usdata 0.26.0
sources: observations
noaa:climate-normals
Palecki, Michael; Durre, Imke; Applequist, Scott; Arguez, Anthony; Lawrimore, Jay (2021). U.S. Climate Normals 2020 (1991-2020). NOAA National Centers for Environmental Information; cite the record for the period used
homepage: https://www.ncei.noaa.gov/products/land-based-station/us-climate-normals
license: US Government Work (public domain)
terms: https://www.ncei.noaa.gov/products/land-based-station/us-climate-normals
retrieved: 2026-09-24; 1 checksummed asset (3,430 bytes) pinned by usdata 0.26.0
sources: normals
What was awkward
- One airport has different identifiers in LCD and normals. The manifest spells out both; no automatic station crosswalk is assumed.
- Local standard time looks like an ordinary timestamp but must not follow daylight saving time. The normals also omit the year and February 29.
- Routine observations occur eight minutes before the nearest normal. The tolerance is an analysis choice, and the final report needs the next day's midnight normal, so the normals request runs a day longer than the observations.
- LCD mixes routine, special, synoptic, and summary reports, and quality suffixes can make a temperature nonnumeric. The comparison counts excluded types and invalid values instead of treating every row as an hourly temperature or silently stripping the suffixes.