usdata
The U.S. Climate Normals are NOAA's 30-year averages of station weather, the baseline that "above normal" is measured against. NCEI computes them from 1991 to 2020 station records and publishes hourly, daily, monthly, and annual or seasonal normals through its Access Data Service. One request returns one CSV with a row per station and calendar period, with no year: the rows describe a typical January, not a particular one.
This walkthrough pulls the monthly normal high, low, and precipitation at Will
Rogers World Airport in Oklahoma City. It needs usdata[pandas] and
matplotlib, downloads under 1 kB, and runs in a few seconds.
from datetime import UTC, datetime
from pathlib import Path

import matplotlib.pyplot as plt
import pandas as pd

import usdata
from usdata import cite_lockfile, pull, verify

# One figure style for every usdata notebook, so previews look alike.
plt.rcParams.update(
    {
        "figure.figsize": (8, 4.5),
        "figure.dpi": 120,
        "axes.spines.top": False,
        "axes.spines.right": False,
        "axes.grid": True,
        "grid.alpha": 0.3,
        "font.size": 10,
    }
)
manifest = Path("dataset.yaml")
print("Executed (UTC):", datetime.now(UTC).isoformat(timespec="seconds"))
print(f"usdata {usdata.__version__}; pandas {pd.__version__}")
Executed (UTC): 2026-09-24T05:58:03+00:00
usdata 0.26.0; pandas 3.0.6
Select
The manifest names one station, three NCEI data-type codes, and
period: monthly. It has no dates: normals are averages, not observations, so
without a window the whole calendar year is requested. For monthly, daily,
and hourly normals a start and end pick a month-day window and the year
is ignored. MLY-TMAX-NORMAL and MLY-TMIN-NORMAL are the normal daily high
and low averaged over each month, and MLY-PRCP-NORMAL the normal monthly
total. units: metric asks for degrees Celsius and millimetres.
print(manifest.read_text())name: okc-climate-normals
sources:
- dataset: noaa:climate-normals
variables: [MLY-TMAX-NORMAL, MLY-TMIN-NORMAL, MLY-PRCP-NORMAL]
params:
period: monthly
stations: USW00013967
units: metric
What arrives
The first pull downloads one CSV and writes dataset.lock.json beside the
manifest, pinning the file's checksum. The request URL carries the
placeholder year 2020 that the adapter sends for a calendar window.
result = pull(manifest)
(item,) = result.fetched
print("File:", item.path.name)
print("Bytes:", item.provenance.size)
print("Source:", item.provenance.source_url)
print("Retrieved (UTC):", item.provenance.retrieved_at.isoformat(timespec="seconds"))
print("Checksum:", item.provenance.checksum)
print("Asset time bounds:", item.asset.time.start.date(), "to", item.asset.time.end.date())
File: normals-monthly-1991-2020_01-01_12-31_75003fc400d9.csv
Bytes: 967
Source: https://www.ncei.noaa.gov/access/services/data/v1?dataset=normals-monthly-1991-2020&stations=USW00013967&format=csv&units=metric&includeStationLocation=1&startDate=2020-01-01&endDate=2020-12-31&dataTypes=MLY-TMAX-NORMAL%2CMLY-TMIN-NORMAL%2CMLY-PRCP-NORMAL
Retrieved (UTC): 2026-09-24T05:58:04+00:00
Checksum: sha256:187e68af78e294fbe10e9b8209ca875e9eb0a68808628189b306187eea688d53
Asset time bounds: 1991-01-01 to 2020-12-31
Open
The generic CSV reader returns a DataFrame with one row per calendar month.
DATE is the two-digit month, 01 to 12, with no year; reading it as text
keeps the leading zero. The normal columns are named by their NCEI codes.
NCEI's CSV has no units row, so the units come from the request: degrees
Celsius for the temperatures and millimetres for precipitation. Each row
repeats the station's latitude, longitude, and elevation in metres.
normals = item.open_csv(dtype={"DATE": "string"})
columns = ["MLY-TMAX-NORMAL", "MLY-TMIN-NORMAL", "MLY-PRCP-NORMAL"]
station = normals.iloc[0]
print(f"{len(normals)} rows, months {normals['DATE'].iloc[0]} to {normals['DATE'].iloc[-1]}")
print(
    f"{station['STATION']} at {station['LATITUDE']}, {station['LONGITUDE']}, "
    f"elevation {station['ELEVATION']} m"
)
normals[["DATE", *columns]].head()
12 rows, months 01 to 12
USW00013967 at 35.3889, -97.6006, elevation 391.7 m
| DATE | MLY-TMAX-NORMAL | MLY-TMIN-NORMAL | MLY-PRCP-NORMAL | |
|---|---|---|---|---|
| 0 | 01 | 9.6 | -2.8 | 33.5 |
| 1 | 02 | 12.1 | -0.7 | 36.1 |
| 2 | 03 | 17.2 | 4.2 | 64.8 |
| 3 | 04 | 21.7 | 8.6 | 91.4 |
| 4 | 05 | 26.1 | 14.2 | 134.9 |
A first look
The normal year at the airport: the band between the normal daily low and high for each month, and the normal monthly precipitation below it.
month = normals["DATE"].astype(int)
labels = ["J", "F", "M", "A", "M", "J", "J", "A", "S", "O", "N", "D"]

fig, (warm, wet) = plt.subplots(
    2, 1, sharex=True, layout="constrained", gridspec_kw={"height_ratios": [3, 2]}
)
warm.fill_between(
    month, normals["MLY-TMIN-NORMAL"], normals["MLY-TMAX-NORMAL"], color="#b45631", alpha=0.2
)
warm.plot(month, normals["MLY-TMAX-NORMAL"], marker="o", color="#b45631", label="Normal high")
warm.plot(month, normals["MLY-TMIN-NORMAL"], marker="o", color="#2f6f8f", label="Normal low")
warm.axhline(0, color="black", linewidth=0.8)
warm.set_ylabel("Temperature (°C)")
warm.set_title("Will Rogers World Airport, Oklahoma City: 1991 to 2020 monthly normals")
warm.legend(loc="upper left", frameon=False)
wet.bar(month, normals["MLY-PRCP-NORMAL"], color="#2563a6")
wet.set_ylabel("Precipitation (mm)")
wet.set_xticks(range(1, 13), labels)
wet.set_xlabel("Calendar month")
plt.show()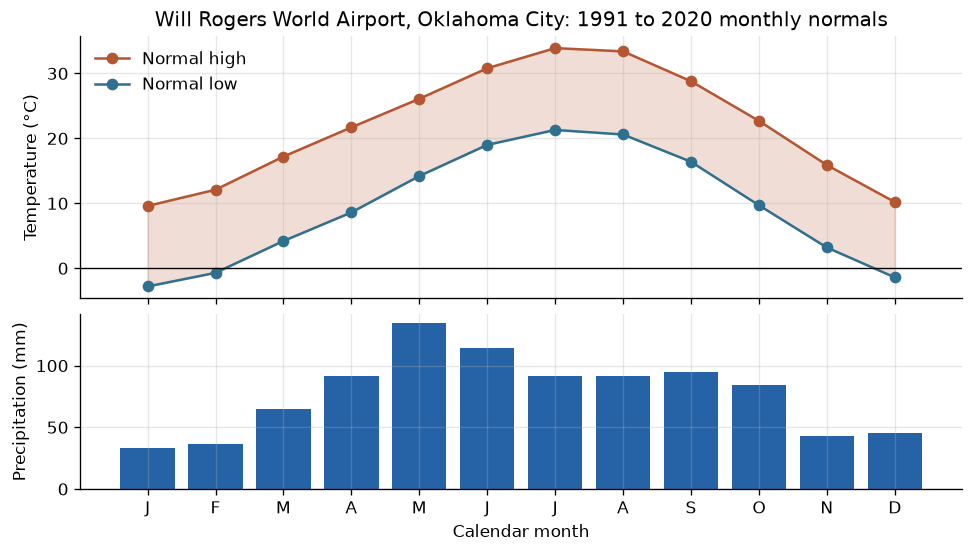
by_month = normals.set_index("DATE")
wettest = by_month["MLY-PRCP-NORMAL"].idxmax()
driest = by_month["MLY-PRCP-NORMAL"].idxmin()
freezing = by_month.index[by_month["MLY-TMIN-NORMAL"] < 0].tolist()
print(f"Normal annual precipitation: {by_month['MLY-PRCP-NORMAL'].sum():.0f} mm")
print(f"Wettest month {wettest}: {by_month.loc[wettest, 'MLY-PRCP-NORMAL']:.1f} mm")
print(f"Driest month {driest}: {by_month.loc[driest, 'MLY-PRCP-NORMAL']:.1f} mm")
print(f"Hottest normal high: {by_month['MLY-TMAX-NORMAL'].max():.1f} °C")
print("Months with a normal low below freezing:", ", ".join(freezing))
Normal annual precipitation: 924 mm
Wettest month 05: 134.9 mm
Driest month 01: 33.5 mm
Hottest normal high: 33.9 °C
Months with a normal low below freezing: 01, 02, 12
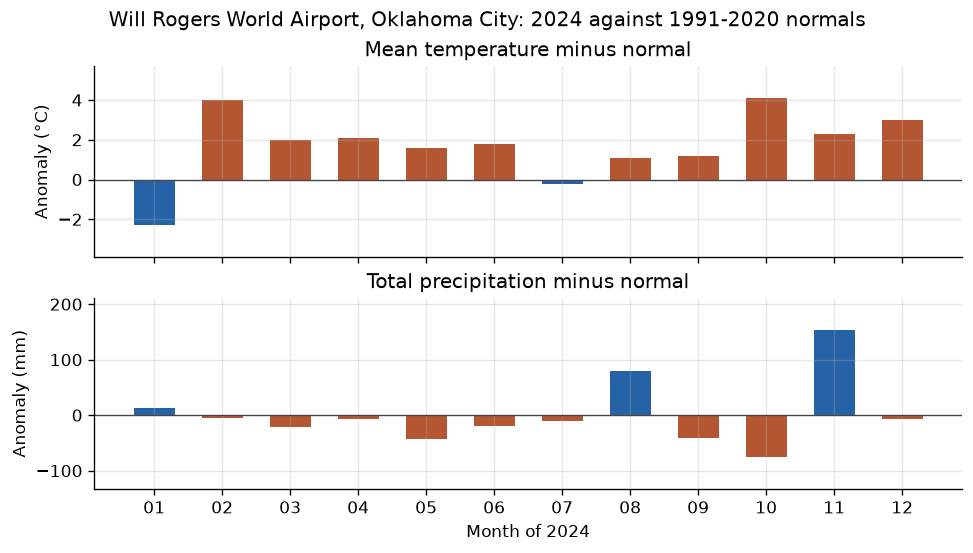
Normal precipitation peaks in May at almost four times January's, with a slight second rise in September; winter is the dry season. The normal low drops below freezing only in December, January, and February. A single year departs from these in both directions; the Global Summary of the Month gives the observed months to compare, and the climate anomalies study does that for 2024.
Pin and cite
verify checks the cached file against the lockfile's checksum. Normals are
republished about once a decade but the 1991 to 2020 files can still be
corrected, and a checksum cannot recreate bytes upstream no longer serves, so
keep the cache with the manifest and lockfile. usdata cite dataset.yaml
prints the same citation.
assert verify(manifest) == []
for citation in cite_lockfile(manifest):
    print(citation.as_text())
noaa:climate-normals
Palecki, Michael; Durre, Imke; Applequist, Scott; Arguez, Anthony; Lawrimore, Jay (2021). U.S. Climate Normals 2020 (1991-2020). NOAA National Centers for Environmental Information; cite the record for the period used
homepage: https://www.ncei.noaa.gov/products/land-based-station/us-climate-normals
license: US Government Work (public domain)
terms: https://www.ncei.noaa.gov/products/land-based-station/us-climate-normals
retrieved: 2026-09-24; 1 checksummed asset (967 bytes) pinned by usdata 0.26.0
sources: 1
What was awkward
units: metricis not applied uniformly.MLY-TAVG-NORMALcomes back in degrees Fahrenheit under either setting, and differences such as the diurnal range (*-DUTR-*) and*-STDDEVcodes are converted as if they were absolute temperatures, so they come back negative. This walkthrough uses only codes that were checked; the normals guide lists what was probed.- The service does not reject an unknown data-type code; a misspelled code returns an empty column instead of an error.
DATEis01to12and reads as an integer unless told otherwise;dtype={"DATE": "string"}keeps it a label.- The asset's time bounds are the whole 1991 to 2020 normals period, while the request URL shows the placeholder year 2020. Neither is a date the values belong to.
- The CSV carries no units, so the manifest's
units: metrichas to travel with the data.