 usdata
Compare 2024 monthly observations at Will Rogers World Airport in Oklahoma City with the 1991–2020 normals for the same station. The anomaly is the observed value minus its normal: a positive temperature anomaly means the month ran warmer than its 30-year average, and a positive precipitation anomaly means it was wetter. The answer describes this station and year, not a climate trend or statistical significance.
This study needs usdata[pandas] and matplotlib. It downloads two small CSVs,
under 2 KB together, and runs in a few seconds.
Show code
from datetime import UTC, datetime
from pathlib import Path

import matplotlib.pyplot as plt
import pandas as pd
from IPython.display import display

import usdata
from usdata import cite_lockfile, pull, verify

# One figure style for every usdata notebook, so previews look alike.
plt.rcParams.update(
    {
        "figure.figsize": (8, 4.5),
        "figure.dpi": 120,
        "axes.spines.top": False,
        "axes.spines.right": False,
        "axes.grid": True,
        "grid.alpha": 0.3,
        "font.size": 10,
    }
)
manifest = Path("dataset.yaml")
print("Executed (UTC):", datetime.now(UTC).isoformat(timespec="seconds"))
print(f"usdata {usdata.__version__}; pandas {pd.__version__}")
Executed (UTC): 2026-09-24T05:58:08+00:00
usdata 0.26.0; pandas 3.0.6
Data
One manifest declares the two sources the comparison needs:
- Monthly station climate (GSOM): the observations, the twelve 2024 UTC calendar months of mean temperature and total precipitation at station USW00013967.
- Climate normals: the
1991–2020 baseline for the same station. The source carries no dates,
because normals are 30-year averages rather than observations;
period: monthlyselects the monthly dataset, and the whole year comes back.
units: metric asks both services for millimetres and degrees Celsius.
Show code
print(manifest.read_text())name: okc-climate-anomalies
sources:
- dataset: noaa:gsom
start: 2024-01-01
end: 2024-12-31
variables: [TAVG, PRCP]
params:
stations: USW00013967
units: metric
- dataset: noaa:climate-normals
variables: [MLY-TAVG-NORMAL, MLY-PRCP-NORMAL]
params:
period: monthly
stations: USW00013967
units: metric
Pull and open both sources
The first pull writes one lockfile, covering both assets, next to the manifest.
Index the fetched items by dataset_id rather than by position. The two DATE
columns are different labels: GSOM uses YYYY-MM and monthly normals use MM,
so both are read as text with an explicit dtype.
NCEI's units=metric converts MLY-PRCP-NORMAL but not MLY-TAVG-NORMAL,
which comes back in degrees Fahrenheit, keeping the leading spaces the service
puts on standard-unit values. That is not the only data type units=metric
gets wrong; the normals guide
lists what was probed, including the derived codes it mis-converts. Read
MLY-TAVG-NORMAL as text so the mismatch stays visible instead of quietly
subtracting Fahrenheit from Celsius below.
Show code
result = pull(manifest)
items = {item.asset.dataset_id: item for item in result.fetched}
assert len(items) == len(result.fetched) == 2, "expected exactly one asset per source"
observed = items["noaa:gsom"].open_csv(dtype={"DATE": "string"}).set_index("DATE")
normals = (
    items["noaa:climate-normals"]
    .open_csv(dtype={"DATE": "string", "MLY-TAVG-NORMAL": "string"})
    .set_index("DATE")
)
print(f"Observed months: {len(observed)}; monthly normals rows: {len(normals)}")
display(observed[["STATION", "PRCP", "TAVG"]].head(3))
display(normals[["MLY-PRCP-NORMAL", "MLY-TAVG-NORMAL"]].head(3))
Observed months: 12; monthly normals rows: 12
| STATION | PRCP | TAVG | |
|---|---|---|---|
| DATE | |||
| 2024-01 | USW00013967 | 45.7 | 1.1 |
| 2024-02 | USW00013967 | 31.7 | 9.7 |
| 2024-03 | USW00013967 | 42.7 | 12.7 |
| MLY-PRCP-NORMAL | MLY-TAVG-NORMAL | |
|---|---|---|
| DATE | ||
| 01 | 33.5 | 38.2 |
| 02 | 36.1 | 42.3 |
| 03 | 64.8 | 51.2 |
Show code
for item in result.fetched:
    print(item.asset.dataset_id)
    print(f"Bytes: {item.provenance.size}; cache hit: {item.from_cache}")
    print("Source:", item.provenance.source_url)
    print("Retrieved (UTC):", item.provenance.retrieved_at.isoformat(timespec="seconds"))
    print("Checksum:", item.provenance.checksum)
    print()
noaa:gsom
Bytes: 892; cache hit: False
Source: https://www.ncei.noaa.gov/access/services/data/v1?dataset=global-summary-of-the-month&stations=USW00013967&startDate=2024-01-01&endDate=2024-12-31&format=csv&units=metric&includeStationLocation=1&dataTypes=TAVG%2CPRCP
Retrieved (UTC): 2026-09-24T05:58:08+00:00
Checksum: sha256:9d2617cd3f94200de386b0698c0e01afea7d84466e578c3da05b176b615c7a46
noaa:climate-normals
Bytes: 918; cache hit: False
Source: https://www.ncei.noaa.gov/access/services/data/v1?dataset=normals-monthly-1991-2020&stations=USW00013967&format=csv&units=metric&includeStationLocation=1&startDate=2020-01-01&endDate=2020-12-31&dataTypes=MLY-TAVG-NORMAL%2CMLY-PRCP-NORMAL
Retrieved (UTC): 2026-09-24T05:58:08+00:00
Checksum: sha256:81fe2b4e9d7368e8e9910b18ea9f69db3b4727df236a62080fcc824fe0858fb4
Align the months and subtract
Normals are labelled by two-digit month, so select them in the observed order
and relabel them onto the observed YYYY-MM index before subtracting; a missing
month raises rather than aligning to nothing. The Fahrenheit normal is
converted only after checking its standard-unit marker and that the result is
plausible against the observations.
One station's year against one 30-year baseline is not a trend, and a different baseline period would move every number. Precipitation anomalies are totals, so a single wet month dominates its sign. Missing measurements stay missing.
Show code
aligned = normals.loc[observed.index.str.slice(5, 7)].set_axis(observed.index)
fahrenheit = aligned["MLY-TAVG-NORMAL"]
if not fahrenheit.str.startswith(" ").all():
    raise ValueError("MLY-TAVG-NORMAL lost its standard-unit marker; recheck units first")
tavg_normal = (fahrenheit.astype("float64") - 32) * 5 / 9
if (observed["TAVG"] - tavg_normal).abs().max() > 10:
    raise ValueError("converted MLY-TAVG-NORMAL is implausible against observed TAVG")
prcp_normal = aligned["MLY-PRCP-NORMAL"]
frame = pd.DataFrame(
    {
        "TAVG": observed["TAVG"],
        "TAVG normal": tavg_normal,
        "TAVG anomaly": observed["TAVG"] - tavg_normal,
        "PRCP": observed["PRCP"],
        "PRCP normal": prcp_normal,
        "PRCP anomaly": observed["PRCP"] - prcp_normal,
    }
).round(1)
assert frame.notna().all().all(), "every selected month needs an observation and a normal"
frame| TAVG | TAVG normal | TAVG anomaly | PRCP | PRCP normal | PRCP anomaly | |
|---|---|---|---|---|---|---|
| DATE | ||||||
| 2024-01 | 1.1 | 3.4 | -2.3 | 45.7 | 33.5 | 12.2 |
| 2024-02 | 9.7 | 5.7 | 4.0 | 31.7 | 36.1 | -4.4 |
| 2024-03 | 12.7 | 10.7 | 2.0 | 42.7 | 64.8 | -22.1 |
| 2024-04 | 17.3 | 15.2 | 2.1 | 84.7 | 91.4 | -6.7 |
| 2024-05 | 21.7 | 20.1 | 1.6 | 91.8 | 134.9 | -43.1 |
| 2024-06 | 26.7 | 24.9 | 1.8 | 95.2 | 114.0 | -18.8 |
| 2024-07 | 27.4 | 27.6 | -0.2 | 80.8 | 91.2 | -10.4 |
| 2024-08 | 28.2 | 27.1 | 1.1 | 171.5 | 91.4 | 80.1 |
| 2024-09 | 23.8 | 22.6 | 1.2 | 54.1 | 94.5 | -40.4 |
| 2024-10 | 20.3 | 16.2 | 4.1 | 8.6 | 84.3 | -75.7 |
| 2024-11 | 11.9 | 9.6 | 2.3 | 196.3 | 42.7 | 153.6 |
| 2024-12 | 7.4 | 4.4 | 3.0 | 39.3 | 45.5 | -6.2 |
Each month's departure from its 1991–2020 normal: warmer and drier months in orange, cooler and wetter months in blue.
Show code
months = frame.index.str.slice(5, 7)
fig, axes = plt.subplots(2, 1, sharex=True, layout="constrained")
for ax, column, title, unit, (above, below) in zip(
    axes,
    ["TAVG anomaly", "PRCP anomaly"],
    ["Mean temperature minus normal", "Total precipitation minus normal"],
    ["Anomaly (°C)", "Anomaly (mm)"],
    [("#b45631", "#2563a6"), ("#2563a6", "#b45631")],
    strict=True,
):
    values = frame[column]
    ax.bar(months, values, width=0.6, color=[above if value >= 0 else below for value in values])
    ax.axhline(0, color="#444444", linewidth=0.8)
    ax.set_title(title)
    ax.set_ylabel(unit)
    ax.margins(y=0.25)
axes[-1].set_xlabel("Month of 2024")
fig.suptitle("Will Rogers World Airport, Oklahoma City: 2024 against 1991-2020 normals")
plt.show()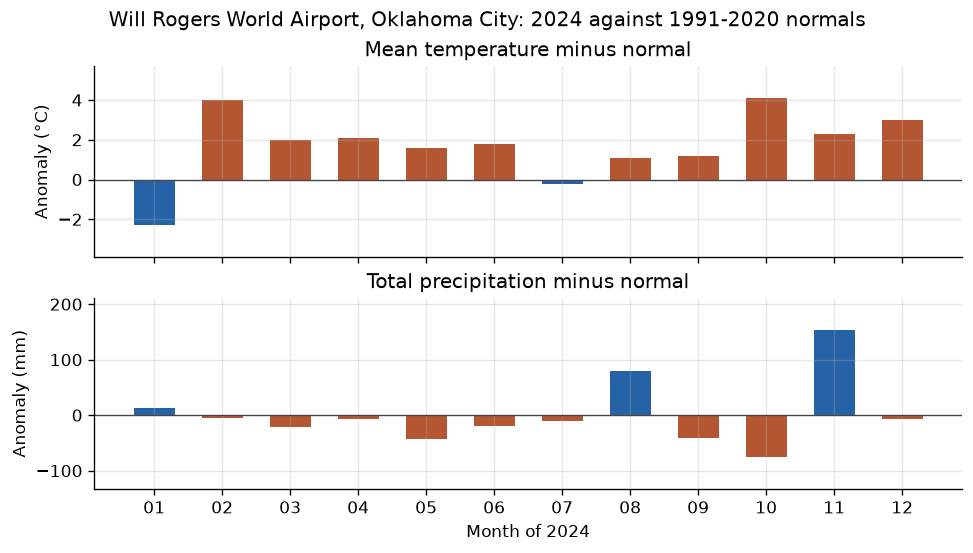
What the comparison shows
Count warmer-than-normal months and compare the twelve-month precipitation total with the sum of the monthly normals. The summary uses the unrounded values; the table and plot round to one decimal place. "Normal" here means the 1991–2020 average at this station, not a threshold for statistical significance.
Show code
temperature_difference = observed["TAVG"] - tavg_normal
precipitation_difference = observed["PRCP"].sum() - prcp_normal.sum()
warmer_months = int((temperature_difference > 0).sum())
wetness = (
    "wetter"
    if precipitation_difference > 0
    else "drier"
    if precipitation_difference < 0
    else "equal to normal"
)
print(f"{warmer_months} of 12 months had a higher mean temperature than normal.")
print(f"2024 precipitation: {observed['PRCP'].sum():.1f} mm; normal: {prcp_normal.sum():.1f} mm.")
print(f"The year was {wetness}: {precipitation_difference:+.1f} mm relative to normal.")
print("Scope: Will Rogers World Airport, 2024, compared with 1991-2020 monthly normals.")
10 of 12 months had a higher mean temperature than normal.
2024 precipitation: 942.4 mm; normal: 924.3 mm.
The year was wetter: +18.1 mm relative to normal.
Scope: Will Rogers World Airport, 2024, compared with 1991-2020 monthly normals.
Pin and cite
verify checks the manifest and cached bytes against the lockfile, offline.
A repeat pull then restores both pinned assets from the lockfile and the
cache. Keep the manifest, lockfile, and cached bytes together; the citations
below are what a methods section needs, and usdata cite dataset.yaml prints
the same.
Show code
assert verify(manifest) == []
again = pull(manifest)
print(f"Restored from lockfile: {again.from_lockfile}")
print(f"All assets came from cache: {all(item.from_cache for item in again.fetched)}")
print()
for citation in cite_lockfile(manifest):
    print(citation.as_text())
Restored from lockfile: True
All assets came from cache: True
noaa:gsom
Lawrimore, Jay H.; Ray, Ron; Applequist, Scott; Korzeniewski, Bryant; Menne, Matthew J. (2016): Global Summary of the Month (GSOM), Version 1. NOAA National Centers for Environmental Information. https://doi.org/10.7289/V5QV3JJ5
homepage: https://www.ncei.noaa.gov/access/search/data-search/global-summary-of-the-month
license: US Government Work (public domain)
terms: https://www.ncei.noaa.gov/metadata/geoportal/rest/metadata/item/gov.noaa.ncdc:C00946/html
retrieved: 2026-09-24; 1 checksummed asset (892 bytes) pinned by usdata 0.26.0
sources: 1
noaa:climate-normals
Palecki, Michael; Durre, Imke; Applequist, Scott; Arguez, Anthony; Lawrimore, Jay (2021). U.S. Climate Normals 2020 (1991-2020). NOAA National Centers for Environmental Information; cite the record for the period used
homepage: https://www.ncei.noaa.gov/products/land-based-station/us-climate-normals
license: US Government Work (public domain)
terms: https://www.ncei.noaa.gov/products/land-based-station/us-climate-normals
retrieved: 2026-09-24; 1 checksummed asset (918 bytes) pinned by usdata 0.26.0
sources: 2
What was awkward
units: metricis not honoured for every normals code:MLY-TAVG-NORMALarrives in degrees Fahrenheit beside a convertedMLY-PRCP-NORMAL, and the only marker is a leading space on the value. Nothing in the asset or its provenance says so; the notebook reads the column as text and checks.- The two sources label months differently (
YYYY-MMagainstMM), so the join is a string slice and a relabel rather than a merge on a shared key. - Neither source is a stable file. Both are query-shaped URLs that the
agencies revise: NCEI revises GSOM as late station reports arrive, and the
1991–2020 normals are corrected occasionally even though their period is
fixed. Restoration then exits 4, reports every asset whose bytes changed,
and rewrites nothing; accepting new bytes is a deliberate
usdata pull dataset.yaml --update noaa:gsom(see--update). A checksum detects a revision but cannot recreate bytes upstream no longer serves.