 usdata
Turn one Storm Events tornado report into a labeled feature row by joining it to
the nearest NEXRAD Level II volume, the nearest MRMS mid-level rotation track,
and the GLM flashes around it, then repeat the rotation and lightning features
over twelve tornado, hail, and thunderstorm-wind reports from the same Oklahoma
evening. The result is a small labeled table of inputs for a classifier that this
notebook deliberately does not train. The worked case is event 1184052, an
EF1 tornado in Oklahoma County, seen by KTLX, MRMS RotationTrackML30min_00.50,
and GOES-16 GLM.
The table has one tornado, two hail, and nine wind rows from fourteen minutes of one supercell's path. It shows how the inputs are built and labeled; it is not a dataset, and the classes are not separable in it.
It needs usdata[pandas,radar,netcdf,grib] and matplotlib; pyproj arrives with the
radar extra. The 80 locked files total about 68 MB, and the empty-cache restore
at the end downloads them once more. Each MRMS grid decodes to about 1.2 GB
before it is cropped, so expect about 1.3 GB of peak memory. A run takes about a
minute.
Show code
import gc
import tempfile
import time
from datetime import UTC, datetime, timedelta, timezone
from importlib.metadata import version
from pathlib import Path

import matplotlib.pyplot as plt
import numpy as np
import pandas as pd
from pyproj import Geod

from usdata import build_query, cite_lockfile, get, pull, select_by_time, verify
from usdata.providers import load_adapter

# One figure style for every usdata notebook, so previews look alike.
plt.rcParams.update(
    {
        "figure.figsize": (8, 4.5),
        "figure.dpi": 120,
        "axes.spines.top": False,
        "axes.spines.right": False,
        "axes.grid": True,
        "grid.alpha": 0.3,
        "font.size": 10,
    }
)
manifest = Path("dataset.yaml")
notebook_started = time.perf_counter()
print("Executed (UTC):", datetime.now(UTC).isoformat(timespec="seconds"))
print(
    "; ".join(
        f"{name} {version(name)}"
        for name in ("usdata", "pandas", "xarray", "xradar", "eccodes", "pyproj")
    )
)
Executed (UTC): 2026-09-24T06:04:25+00:00
usdata 0.26.0; pandas 3.0.6; xarray 2026.7.0; xradar 0.12.0; eccodes 2.48.0; pyproj 3.8.0
Data
The manifest records four inputs, 80 files in all:
| Dataset | What it pins | Why |
|---|---|---|
| Storm Events | The whole 2024 annual details archive | The labels: report type, time, position, rating, magnitude |
| NEXRAD Level II | One KTLX volume, at the scan start found during discovery | Reflectivity around the tornado report |
| MRMS | Nine two-minute RotationTrackML30min_00.50 grids, 04:28 to 04:44 UTC |
The rotation feature for every report |
| GOES GLM | Sixty-nine 20-second GOES-16 files, 04:25 to 04:47 UTC | The lightning feature for every report |
Each dataset returns whole files; every spatial and temporal narrowing below
happens locally after download. NCEI can revise the annual archive; the lock
pins its creation-date filename and checksum. On later runs, pull restores
the lock without repeating provider discovery.
Show code
print(manifest.read_text().strip())

started = time.perf_counter()
result = pull(manifest)
by_dataset: dict[str, list] = {}
for item in result.fetched:
    by_dataset.setdefault(item.asset.dataset_id, []).append(item)
print("\nPull seconds:", round(time.perf_counter() - started, 2))
print("Total source bytes:", sum(item.provenance.size for item in result.fetched))
summary = pd.DataFrame(
    {
        "dataset": dataset,
        "files": len(items),
        "bytes": sum(item.provenance.size for item in items),
        "first": min(item.asset.id for item in items),
        "retrieved_utc": max(item.provenance.retrieved_at for item in items).isoformat(
            timespec="seconds"
        ),
    }
    for dataset, items in by_dataset.items()
)
assert set(summary.dataset) == {
    "noaa:storm-events",
    "noaa:nexrad-level2",
    "noaa:mrms",
    "noaa:goes-glm",
}
summary
name: oklahoma-severe-reports-2024-05-06
sources:
- dataset: noaa:storm-events
start: '2024-05-06'
end: '2024-05-06'
- dataset: noaa:nexrad-level2
start: '2024-05-07T04:40:53+00:00'
end: '2024-05-07T04:40:53+00:00'
params:
site: KTLX
- dataset: noaa:mrms
start: '2024-05-07T04:28:00+00:00'
end: '2024-05-07T04:44:00+00:00'
params:
product: RotationTrackML30min_00.50
- dataset: noaa:goes-glm
start: '2024-05-07T04:25:00+00:00'
end: '2024-05-07T04:47:59+00:00'
params:
satellite: 16
Pull seconds: 10.65
Total source bytes: 67817291
| dataset | files | bytes | first | retrieved_utc | |
|---|---|---|---|---|---|
| 0 | noaa:storm-events | 1 | 12693243 | StormEvents_details-ftp_v1.0_d2024_c20260728.c... | 2026-09-24T06:04:26+00:00 |
| 1 | noaa:nexrad-level2 | 1 | 19826021 | KTLX20240507_044053_V06 | 2026-09-24T06:04:28+00:00 |
| 2 | noaa:mrms | 9 | 1678478 | MRMS_RotationTrackML30min_00.50_20240507-04280... | 2026-09-24T06:04:29+00:00 |
| 3 | noaa:goes-glm | 69 | 33619549 | OR_GLM-L2-LCFA_G16_s20241280425000_e2024128042... | 2026-09-24T06:04:36+00:00 |
Read the reports' time convention explicitly
NCEI event 1184052
is an EF1 tornado report beginning in Oklahoma County at 22:39 on May 6, 2024.
The bulk-format reference
identifies local standard time and the CZ_TIMEZONE offset. Every Oklahoma row
in this archive says CST-6: use fixed UTC−6, giving 04:39 UTC on May 7. A
regional zone with daylight saving would shift the case by an hour, so the cell
below refuses any other label rather than guessing, and checks its conversion
against the BEGIN_UTC column the reader derives. Coordinates mark the reported
path start; a report record is not necessarily an independent storm.
The twelve-report table takes the first twelve Oklahoma tornado, hail, and thunderstorm-wind rows beginning between 04:30 and 04:42 UTC, ordered by begin time and event id. That fourteen-minute span is the evening's most active stretch around the case and keeps every needed MRMS and GLM file inside one manifest.
Show code
columns = [
    "EVENT_ID",
    "EVENT_TYPE",
    "STATE",
    "CZ_NAME",
    "BEGIN_DATE_TIME",
    "END_DATE_TIME",
    "CZ_TIMEZONE",
    "BEGIN_LAT",
    "BEGIN_LON",
    "TOR_F_SCALE",
    "MAGNITUDE",
]
frame = by_dataset["noaa:storm-events"][0].open_csv(usecols=columns)
reports = frame.loc[
    frame.STATE.eq("OKLAHOMA") & frame.EVENT_TYPE.isin(["Tornado", "Hail", "Thunderstorm Wind"])
].copy()
if set(reports.CZ_TIMEZONE) != {"CST-6"}:
    raise ValueError(f"Review source timezones before matching: {set(reports.CZ_TIMEZONE)}")
local = pd.to_datetime(reports.BEGIN_DATE_TIME, format="%d-%b-%y %H:%M:%S")
reports["begin_utc"] = local.dt.tz_localize(timezone(timedelta(hours=-6))).dt.tz_convert("UTC")
assert (reports.begin_utc == reports.BEGIN_UTC).all(), "the reader derived a different UTC time"
reports["BEGIN_LAT"] = reports.BEGIN_LAT.astype(float)
reports["BEGIN_LON"] = reports.BEGIN_LON.astype(float)
assert reports[["BEGIN_LAT", "BEGIN_LON"]].notna().all().all()

case = reports.loc[reports.EVENT_ID.eq("1184052")].iloc[0]
event_time = case.begin_utc.to_pydatetime()
lat, lon = float(case.BEGIN_LAT), float(case.BEGIN_LON)
print(
    "Case:", case[["EVENT_ID", "EVENT_TYPE", "CZ_NAME", "BEGIN_DATE_TIME", "TOR_F_SCALE"]].to_dict()
)
print("Case start UTC:", event_time.isoformat())

window = reports.loc[
    reports.begin_utc.between("2024-05-07T04:30:00Z", "2024-05-07T04:42:00Z")
].sort_values(["begin_utc", "EVENT_ID"])
selected = window.head(12).reset_index(drop=True)
assert set(selected.EVENT_TYPE) == {"Tornado", "Hail", "Thunderstorm Wind"}
assert case.EVENT_ID in set(selected.EVENT_ID)
print("Reports in the 04:30-04:42 UTC window:", len(window), "· selected:", len(selected))
print(selected.EVENT_TYPE.value_counts().to_dict())
del frame
gc.collect();
Case: {'EVENT_ID': '1184052', 'EVENT_TYPE': 'Tornado', 'CZ_NAME': 'OKLAHOMA', 'BEGIN_DATE_TIME': '06-MAY-24 22:39:00', 'TOR_F_SCALE': 'EF1'}
Case start UTC: 2024-05-07T04:39:00+00:00
Reports in the 04:30-04:42 UTC window: 15 · selected: 12
{'Thunderstorm Wind': 9, 'Hail': 2, 'Tornado': 1}
Check the locked selections against live listings
The manifest's radar and MRMS bounds equal scan starts found during discovery.
Rank each provider's live candidates within ±5 minutes of the case time by
absolute start difference with select_by_time and require the winner to be
the locked asset. For GLM, whose 20-second files are all used rather than one
being chosen, require every listed file starting within ±5 minutes of the case
to be in the lock. If any check fails, investigate changed source listings or
report revisions before editing the manifest and deliberately resolving a new
lock. The tolerance is an analysis choice, not an SDK default. This cell is
deliberately live; it is not needed merely to restore an existing analysis.
Show code
tolerance = timedelta(minutes=5)
locked = {dataset: {item.asset.id for item in items} for dataset, items in by_dataset.items()}
checks = []
for dataset_id, params in [
    ("noaa:nexrad-level2", {"site": "KTLX"}),
    ("noaa:mrms", {"product": "RotationTrackML30min_00.50"}),
    ("noaa:goes-glm", {"satellite": 16}),
]:
    query = build_query(start=event_time - tolerance, end=event_time + tolerance, **params)
    with load_adapter(get(dataset_id)) as provider:
        candidates = provider.list_assets(query)
    if dataset_id == "noaa:goes-glm":
        missing = {asset.id for asset in candidates} - locked[dataset_id]
        assert not missing, f"GLM files listed live but not locked: {sorted(missing)[:3]}"
        checks.append({"dataset": dataset_id, "candidates": len(candidates), "locked_match": "all"})
        continue
    selection = select_by_time(
        candidates, target=event_time, tolerance=tolerance, direction="nearest"
    )
    assert selection.asset is not None, f"No start within tolerance: {dataset_id}"
    assert selection.asset.id in locked[dataset_id], "Revisit the manifest selection"
    checks.append(
        {
            "dataset": dataset_id,
            "candidates": selection.candidate_count,
            "locked_match": selection.asset.id,
            "start_offset_seconds": selection.offset_seconds,
        }
    )
pd.DataFrame(checks)| dataset | candidates | locked_match | start_offset_seconds | |
|---|---|---|---|---|
| 0 | noaa:nexrad-level2 | 2 | KTLX20240507_044053_V06 | 113.0 |
| 1 | noaa:mrms | 6 | MRMS_RotationTrackML30min_00.50_20240507-04380... | -60.0 |
| 2 | noaa:goes-glm | 31 | all | NaN |
Three features, each with an explicit neighbourhood
- Reflectivity (
refl_max_dbz): the maximumDBZHon the first KTLX sweep within 25 km ground distance of the report start. Gate positions are computed from azimuth and slant range on a flat plane, so 25 km is approximate; the sweep is a 0.5° tilt whose beam is well above the ground at that range. - Rotation (
rotation_max): the maximum MRMS mid-level rotation track, azimuthal shear in 0.001 s⁻¹ accumulated over the trailing 30 minutes, inside a ±0.1° box around the report in the two-minute grid nearest the report time. The source writes negative sentinels for no coverage and no data; they are masked before the maximum. Each grid is cropped to Oklahoma once and the crop is kept, so nine 1.2 GB decodes do not stay in memory. - Lightning (
flash_count): GLM flashes whose centroid lies within ±0.25° of the report in files starting within ±5 minutes of the report time, summed over GOES-16 only. Flash centroids are cloud-top positions, not ground strikes.
None of these is a tornado detector. They are the kind of inputs a classifier would consume, computed transparently so their limits are visible.
Show code
radar_item = by_dataset["noaa:nexrad-level2"][0]
radar = radar_item.open_nexrad(sweep=0)
sweep = radar["sweep_0"].to_dataset()
assert sweep.DBZH.attrs["units"] == "dBZ"
radar_lat, radar_lon = float(radar.latitude), float(radar.longitude)
geod = Geod(ellps="WGS84")
azimuth = np.deg2rad(sweep.azimuth.values)[:, None]
slant = sweep.range.values[None, :]
gate_x, gate_y = slant * np.sin(azimuth), slant * np.cos(azimuth)
reflectivity = sweep.DBZH.values


def reflectivity_max(point_lat: float, point_lon: float, radius_km: float = 25.0) -> float:
    """Maximum first-sweep DBZH within a flat-plane ground radius of the point."""
    bearing, _, distance = geod.inv(radar_lon, radar_lat, point_lon, point_lat)
    px, py = distance * np.sin(np.deg2rad(bearing)), distance * np.cos(np.deg2rad(bearing))
    inside = np.hypot(gate_x - px, gate_y - py) <= radius_km * 1000
    assert inside.any(), "report lies outside the sweep"
    return float(np.nanmax(np.where(inside, reflectivity, np.nan)))


started = time.perf_counter()
rotation_crops: dict[datetime, object] = {}
for item in by_dataset["noaa:mrms"]:
    grid = item.open()
    (name,) = grid.data_vars
    crop = grid[name].sel(latitude=slice(37.2, 33.4), longitude=slice(257.0, 266.0)).load()
    rotation_crops[item.asset.time.start] = crop.where(crop >= 0)
    del grid, crop
    gc.collect()
print(
    "MRMS grids decoded and cropped:",
    len(rotation_crops),
    "in",
    round(time.perf_counter() - started, 1),
    "s",
)


def rotation_max(
    when: datetime, point_lat: float, point_lon: float, half: float = 0.1
) -> tuple[datetime, float]:
    """Nearest grid stamp and the maximum rotation track inside a ±half-degree box."""
    stamp = min(rotation_crops, key=lambda start: (abs((start - when).total_seconds()), start))
    box = rotation_crops[stamp].sel(
        latitude=slice(point_lat + half, point_lat - half),
        longitude=slice(point_lon + 360 - half, point_lon + 360 + half),
    )
    return stamp, float(box.max()) if int(box.count()) else float("nan")


flashes: dict[datetime, tuple[np.ndarray, np.ndarray]] = {}
for item in by_dataset["noaa:goes-glm"]:
    detections = item.open()
    flashes[item.asset.time.start] = (
        detections.flash_lat.values.copy(),
        detections.flash_lon.values.copy(),
    )
    del detections
print(
    "GLM files:",
    len(flashes),
    "· flashes in files:",
    sum(len(pair[0]) for pair in flashes.values()),
)


def flash_count(when: datetime, point_lat: float, point_lon: float, half: float = 0.25) -> int:
    """GLM flashes within ±half degrees in files starting within the tolerance of when."""
    count = 0
    for start, (flash_lat, flash_lon) in flashes.items():
        if abs((start - when).total_seconds()) <= tolerance.total_seconds():
            near = (np.abs(flash_lat - point_lat) <= half) & (np.abs(flash_lon - point_lon) <= half)
            count += int(near.sum())
    return count


stamp, case_rotation = rotation_max(event_time, lat, lon)
case_row = {
    "event_id": case.EVENT_ID,
    "utc_time": event_time.isoformat(),
    "lat": lat,
    "lon": lon,
    "label": "tornado",
    "ef": case.TOR_F_SCALE,
    "refl_max_dbz": reflectivity_max(lat, lon),
    "rotation_max": case_rotation,
    "rotation_grid_utc": stamp.strftime("%H:%M"),
    "flash_count": flash_count(event_time, lat, lon),
}
print(
    "Report ground distance from KTLX (km):",
    round(geod.inv(radar_lon, radar_lat, lon, lat)[2] / 1000, 1),
)
del radar, sweep
gc.collect()
pd.Series(case_row)
MRMS grids decoded and cropped: 9 in 6.6 s
GLM files: 69 · flashes in files: 17158
Report ground distance from KTLX (km): 24.6
event_id                               1184052
utc_time             2024-05-07T04:39:00+00:00
lat                                     35.378
lon                                    -97.543
label                                  tornado
ef                                         EF1
refl_max_dbz                              62.5
rotation_max                              12.0
rotation_grid_utc                        04:38
flash_count                                162
dtype: object
A small labeled table
The loop applies the rotation and lightning features to the twelve selected
reports. Reflectivity is left out of the loop on purpose: it needs a radar volume
per report time, and one volume is about 20 MB, so the single-case row above is
the only radar feature. label is the Storm Events EVENT_TYPE; ef is the
reported rating for tornado rows and the source magnitude (inches of hail or
knots of wind) for the others. Rotation and flash neighbourhoods are the ones
defined above.
Show code
rows = []
for report in selected.itertuples(index=False):
    when = report.begin_utc.to_pydatetime()
    stamp, rotation = rotation_max(when, report.BEGIN_LAT, report.BEGIN_LON)
    rows.append(
        {
            "event_id": report.EVENT_ID,
            "utc_time": when.strftime("%H:%M"),
            "county": report.CZ_NAME,
            "label": report.EVENT_TYPE,
            "ef_or_magnitude": report.TOR_F_SCALE
            if report.EVENT_TYPE == "Tornado"
            else report.MAGNITUDE,
            "lat": round(report.BEGIN_LAT, 3),
            "lon": round(report.BEGIN_LON, 3),
            "rotation_max": rotation,
            "rotation_grid_utc": stamp.strftime("%H:%M"),
            "flash_count": flash_count(when, report.BEGIN_LAT, report.BEGIN_LON),
        }
    )
labeled = pd.DataFrame(rows)
assert len(labeled) == 12 and labeled.rotation_max.notna().all()
print(
    labeled.groupby("label")[["rotation_max", "flash_count"]].agg(["min", "max", "mean"]).round(1)
)
labeled
rotation_max flash_count
min max mean min max mean
label
Hail 13.0 18.0 15.5 141 149 145.0
Thunderstorm Wind 9.0 14.0 12.1 140 239 196.6
Tornado 12.0 12.0 12.0 162 162 162.0
| event_id | utc_time | county | label | ef_or_magnitude | lat | lon | rotation_max | rotation_grid_utc | flash_count | |
|---|---|---|---|---|---|---|---|---|---|---|
| 0 | 1178558 | 04:30 | GRADY | Thunderstorm Wind | 62.0 | 35.272 | -97.956 | 12.0 | 04:30 | 199 |
| 1 | 1178572 | 04:30 | GRADY | Thunderstorm Wind | 70.0 | 35.315 | -97.794 | 14.0 | 04:30 | 235 |
| 2 | 1178578 | 04:30 | CANADIAN | Thunderstorm Wind | 61.0 | 35.384 | -97.742 | 13.0 | 04:30 | 239 |
| 3 | 1185066 | 04:33 | CANADIAN | Thunderstorm Wind | 65.0 | 35.377 | -97.691 | 13.0 | 04:32 | 217 |
| 4 | 1185275 | 04:33 | CLEVELAND | Thunderstorm Wind | 56.0 | 35.363 | -97.632 | 9.0 | 04:32 | 210 |
| 5 | 1181423 | 04:35 | CREEK | Hail | 1.75 | 35.760 | -96.583 | 13.0 | 04:34 | 149 |
| 6 | 1188041 | 04:37 | CLEVELAND | Thunderstorm Wind | 91.0 | 35.366 | -97.563 | 13.0 | 04:36 | 185 |
| 7 | 1178563 | 04:38 | OKLAHOMA | Thunderstorm Wind | 60.0 | 35.389 | -97.600 | 13.0 | 04:38 | 175 |
| 8 | 1185189 | 04:38 | CLEVELAND | Thunderstorm Wind | 61.0 | 35.349 | -97.540 | 12.0 | 04:38 | 169 |
| 9 | 1184052 | 04:39 | OKLAHOMA | Tornado | EF1 | 35.378 | -97.543 | 12.0 | 04:38 | 162 |
| 10 | 1185081 | 04:39 | CLEVELAND | Thunderstorm Wind | 61.0 | 35.272 | -97.496 | 10.0 | 04:38 | 140 |
| 11 | 1185082 | 04:42 | OKLAHOMA | Hail | 1.0 | 35.378 | -97.459 | 18.0 | 04:42 | 141 |
Every report came with both
The left panel is the MRMS rotation track in the grid nearest the tornado report, with the twelve reports drawn at their start points and coloured by class. The right panel places each report by its two features.
Show code
colors = {"Tornado": "#d62728", "Hail": "#1f77b4", "Thunderstorm Wind": "#7f7f7f"}
case_stamp, _ = rotation_max(event_time, lat, lon)
margin = 0.2
west, east = selected.BEGIN_LON.min() - margin, selected.BEGIN_LON.max() + margin
south, north = selected.BEGIN_LAT.min() - margin, selected.BEGIN_LAT.max() + margin
crop = rotation_crops[case_stamp].sel(
    latitude=slice(north, south), longitude=slice(west + 360, east + 360)
)
fig, (ax_map, ax_features) = plt.subplots(
    1, 2, layout="constrained", gridspec_kw={"width_ratios": [1.5, 1]}
)
mesh = ax_map.pcolormesh(
    crop.longitude.values - 360,
    crop.latitude.values,
    crop.values,
    cmap="magma_r",
    shading="auto",
    vmin=0,
    vmax=25,
)
ax_map.scatter(radar_lon, radar_lat, marker="^", s=70, c="white", edgecolors="black", zorder=3)
ax_map.annotate("KTLX", (radar_lon, radar_lat), xytext=(5, -10), textcoords="offset points")
for label, color in colors.items():
    group = selected.loc[selected.EVENT_TYPE.eq(label)]
    ax_map.scatter(
        group.BEGIN_LON,
        group.BEGIN_LAT,
        marker="*" if label == "Tornado" else "o",
        s=180 if label == "Tornado" else 30,
        c=color,
        edgecolors="black",
        zorder=4,
    )
ax_map.grid(False)
ax_map.set(
    xlim=(west, east),
    ylim=(south, north),
    xlabel="Longitude (°E)",
    ylabel="Latitude (°N)",
    title=f"MRMS rotation track, {case_stamp:%H:%M} UTC",
    aspect=1 / np.cos(np.deg2rad(lat)),
)
fig.colorbar(
    mesh, ax=ax_map, label="30-min azimuthal shear (0.001 s$^{-1}$)", shrink=0.7, location="bottom"
)
for label, color in colors.items():
    group = labeled.loc[labeled.label.eq(label)]
    ax_features.scatter(
        group.flash_count,
        group.rotation_max,
        marker="*" if label == "Tornado" else "o",
        s=180 if label == "Tornado" else 45,
        c=color,
        edgecolors="black",
        label=label,
        zorder=3,
    )
ax_features.set(
    xlabel="GLM flashes (±0.25°, ±5 min)",
    ylabel="Rotation max (0.001 s$^{-1}$)",
    title="Twelve reports, two features",
)
ax_features.legend(fontsize=8, loc="upper center")
fig.suptitle("Oklahoma severe reports, 04:30 to 04:42 UTC on 7 May 2024")
plt.show()
plt.close(fig)
del crop
gc.collect();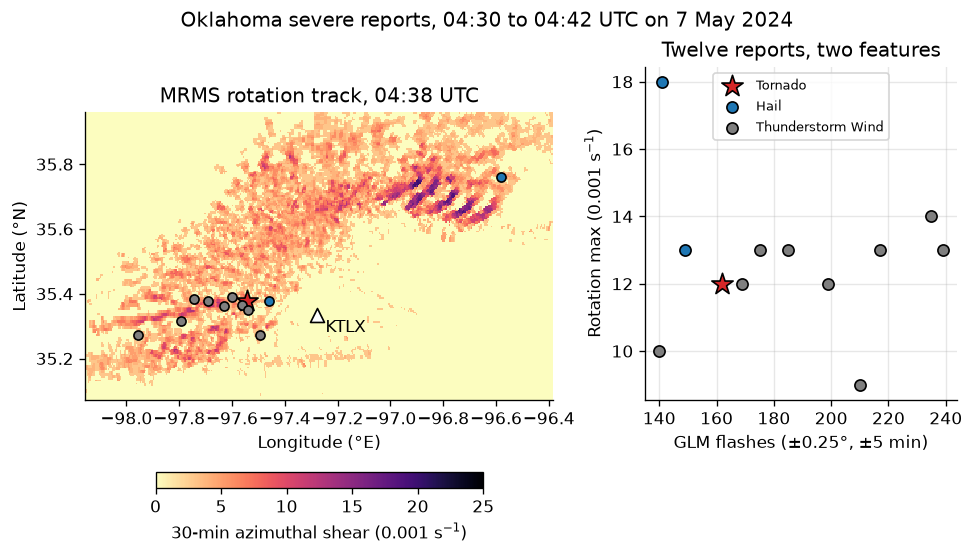
Every one of the twelve reports sits under mid-level rotation (9 to 18 in units of 0.001 s⁻¹) and within reach of 140 to 239 flashes, and the tornado, at 12 and 162, falls inside the range of the hail and wind reports on both. The features describe one supercell, not the class of each report.
What this table can and cannot support
- Times are local standard time. Every conversion above used the row's
CZ_TIMEZONE. A report from another state or timezone label needs its own review before joining to UTC-stamped observations. - Several records can describe one storm. The twelve rows include wind reports minutes apart along one supercell's path plus the tornado it produced; they are not twelve independent samples, and the rotation feature is nearly the same for neighbours because the track product accumulates over 30 minutes.
- A missing report is not a missing hazard. Rows without a tornado are reports of hail or wind, not evidence that no tornado occurred nearby, and the table has no true negatives at all.
- Twelve rows are a demonstration. With one tornado, two hail, and nine wind rows from a single evening the classes are not separable here, and no claim about tornado versus non-tornado rotation values should be read from this table.
- This notebook produces inputs and does not train a model. A real study needs many events across seasons and radars, radar features at every report time, environmental fields such as HRRR CAPE and shear, SPC reports as a second label source, and independent report review.
Pin and cite
verify checks every cached file against the lockfile's checksums, and the
citations below are what a methods section needs; usdata cite dataset.yaml
prints the same.
Show code
assert verify(manifest) == []
for citation in cite_lockfile(manifest):
    print(citation.as_text())
    print()
noaa:storm-events
NOAA National Centers for Environmental Information, Storm Events Database, accessed via usdata
homepage: https://www.ncei.noaa.gov/access/storm-events-database/
license: US Government Work (public domain)
terms: https://www.ncei.noaa.gov/metadata/geoportal/rest/metadata/item/gov.noaa.ncdc:C00510/html
retrieved: 2026-09-24; 1 checksummed asset (12,693,243 bytes) pinned by usdata 0.26.0
sources: 1
noaa:nexrad-level2
NEXRAD on AWS was accessed on 2026-09-24 from https://registry.opendata.aws/noaa-nexrad
homepage: https://registry.opendata.aws/noaa-nexrad/
license: US Government Work (public domain)
terms: https://www.noaa.gov/information-technology/open-data-dissemination
retrieved: 2026-09-24; 1 checksummed asset (19,826,021 bytes) pinned by usdata 0.26.0
sources: 2
noaa:mrms
NOAA Multi-Radar/Multi-Sensor System (MRMS) was accessed on 2026-09-24 from https://registry.opendata.aws/noaa-mrms-pds
homepage: https://registry.opendata.aws/noaa-mrms-pds/
license: US Government Work (public domain)
terms: https://www.noaa.gov/information-technology/open-data-dissemination
retrieved: 2026-09-24; 9 checksummed assets (1,678,478 bytes) pinned by usdata 0.26.0
sources: 3
noaa:goes-glm
NOAA Geostationary Operational Environmental Satellites (GOES) 16, 17, 18 & 19 was accessed on 2026-09-24 from https://registry.opendata.aws/noaa-goes
homepage: https://registry.opendata.aws/noaa-goes/
license: US Government Work (public domain)
terms: https://www.noaa.gov/information-technology/open-data-dissemination
retrieved: 2026-09-24; 69 checksummed assets (33,619,549 bytes) pinned by usdata 0.26.0
sources: 4
A second pull must use verified cached bytes, and a separate temporary empty cache must restore all 80 locked assets without provider re-resolution. This checks the reproducibility mechanism today; upstream can still remove or revise old files, so keep the manifest, the lockfile, and the cached bytes together.
Show code
again = pull(manifest)
assert again.from_lockfile and all(item.from_cache for item in again.fetched)
assert verify(manifest) == []
with tempfile.TemporaryDirectory(prefix="usdata-tornado-restore-") as directory:
    started = time.perf_counter()
    restored = pull(manifest, root=Path(directory))
    assert restored.from_lockfile and not any(item.from_cache for item in restored.fetched)
    assert verify(manifest, root=Path(directory)) == []
    assert sorted(item.provenance.checksum for item in restored.fetched) == sorted(
        item.provenance.checksum for item in result.fetched
    )
    print("Empty-cache restoration seconds:", round(time.perf_counter() - started, 2))
print(
    f"All {len(result.fetched)} inputs verified; cached and empty-cache locked restoration passed."
)
print("Notebook seconds:", round(time.perf_counter() - notebook_started, 1))
Empty-cache restoration seconds: 10.2
All 80 inputs verified; cached and empty-cache locked restoration passed.
Notebook seconds: 47.8
What was awkward
- The manifest's sources have no names, so the notebook groups
result.fetchedby dataset id itself. Named sources, as the severe-weather case study uses, would giveresult.by_sourceinstead. - Checking the lock against today's listings means dropping below the manifest
to
load_adapter,build_query, andlist_assets; there is no manifest-level way to ask whether a re-resolve would pick the same files. - An MRMS grid decodes to about 1.2 GB before anything can be cropped, and the crop needs longitudes in 0 to 360 and a latitude slice from north to south.
- MRMS writes negative sentinels for no coverage and no data inside the value range, so every maximum has to mask them first.
- The reader derives
BEGIN_UTConly whenEND_DATE_TIMEis also among the columns read. Ausecolsthat keepsBEGIN_DATE_TIMEandCZ_TIMEZONEbut notEND_DATE_TIMEgets noBEGIN_UTCand no message saying why. - Storm Events
MAGNITUDEis inches for hail and knots for wind in one column, so a mixed-class table carries two units under one name. - A radar feature at every report time would need a Level II volume per report, about 20 MB each, so only the tornado row has reflectivity.