Studies
Questions answered end to end with real data: the sources, the analysis, the saved results, and pinned inputs anyone can restore. Each dataset's own walkthrough is on its dataset page.
Start here
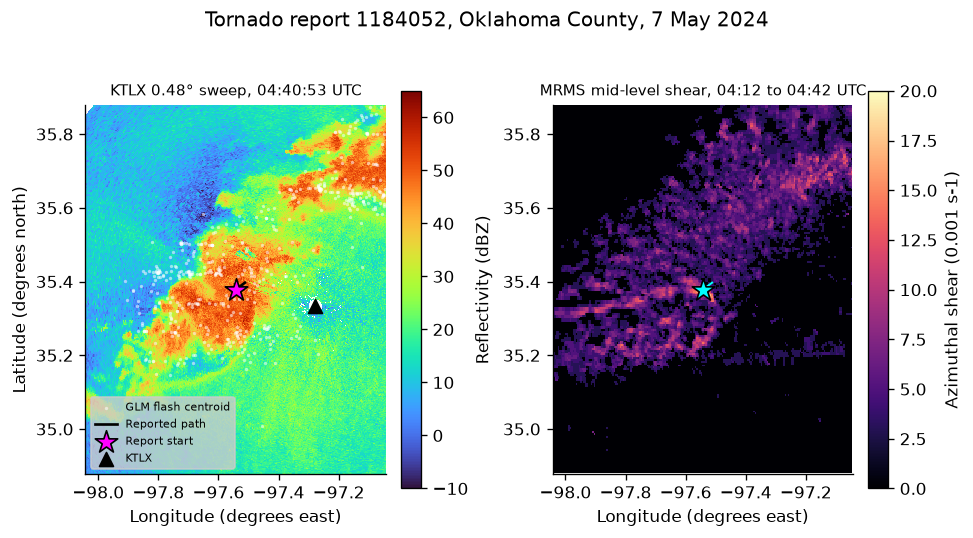
Take one tornado report's UTC time and position out of the 2024 Storm Events archive, check it against the SPC tornado file, and measure what the nearest NEXRAD volume, five MRMS rotation grids, twenty minutes of GOES-16 lightning, and the last HRRR analysis held within 25 km of it.
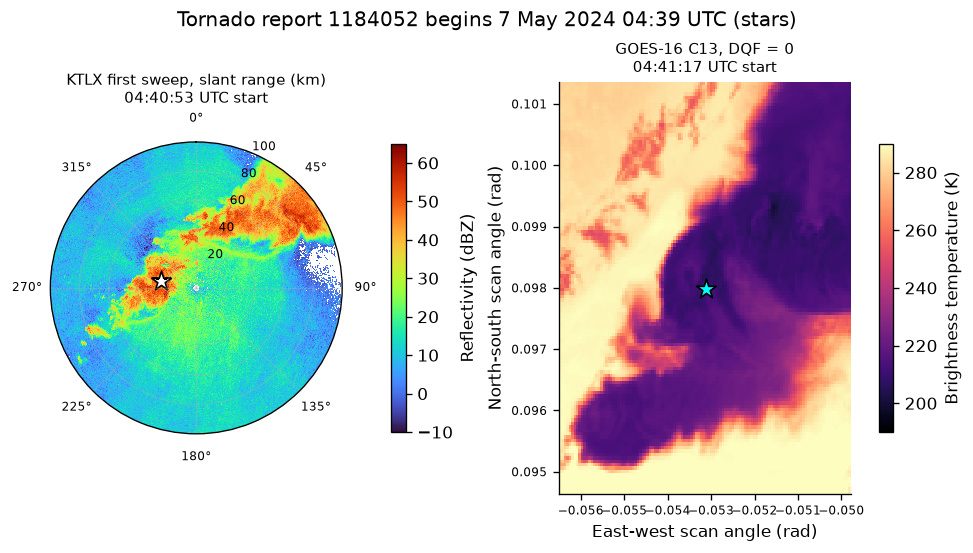
Connect one Storm Events report to nearby NEXRAD and GOES observations, with explicit time matching and a plotted event context.
Storm Events details, fatalities, and locations · NEXRAD radar scans · GOES CONUS and mesoscale imagery
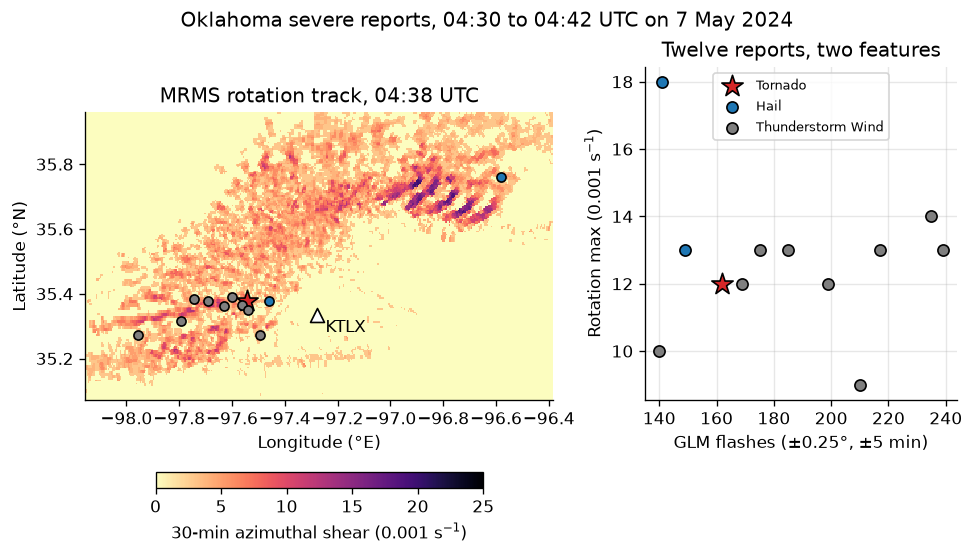
Convert one Oklahoma tornado report to UTC, join it to the nearest NEXRAD volume, MRMS rotation track, and GLM flashes, then build a small labeled table of rotation and lightning features for tornado, hail, and wind reports from the same evening.
Storm Events details, fatalities, and locations · NEXRAD radar scans · MRMS gridded radar products · GOES lightning detections
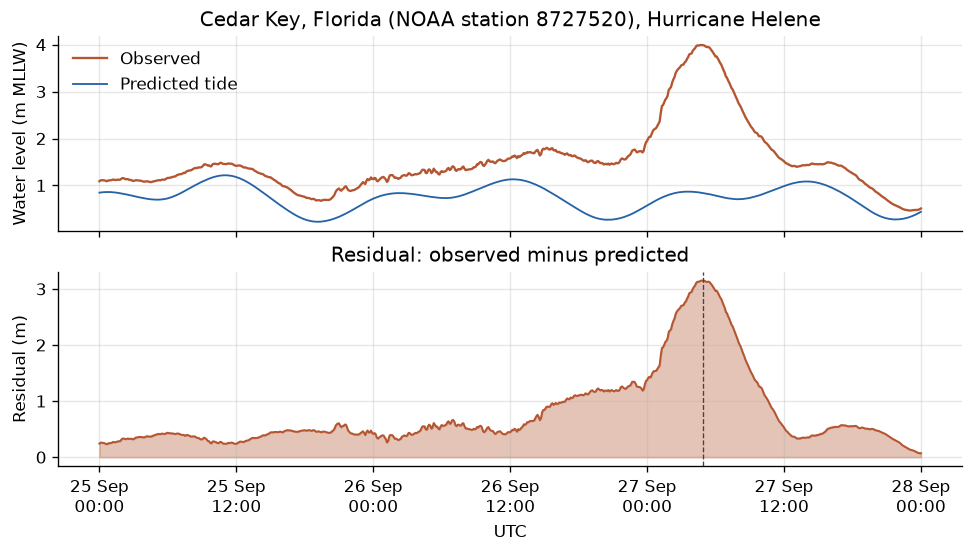
Subtract CO-OPS tide predictions from observed water levels to isolate the surge, find its peak, and time it against the HURDAT2 landfall.
Tropical cyclone best tracks · Coastal water levels · Coastal tide predictions
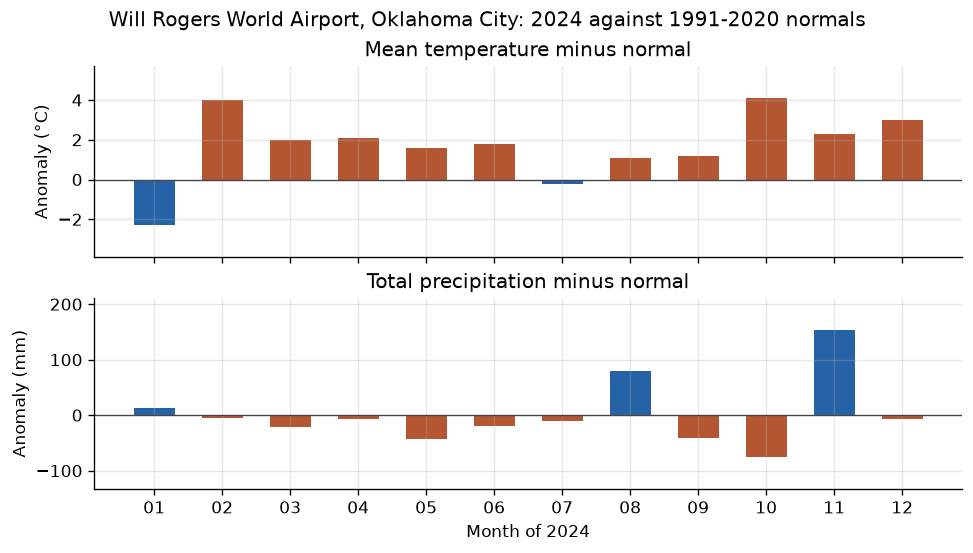
Compare twelve months at Oklahoma City's airport with 1991–2020 station normals, including temperature-unit checks and monthly anomaly plots.
Monthly station climate · 30-year station climate normals
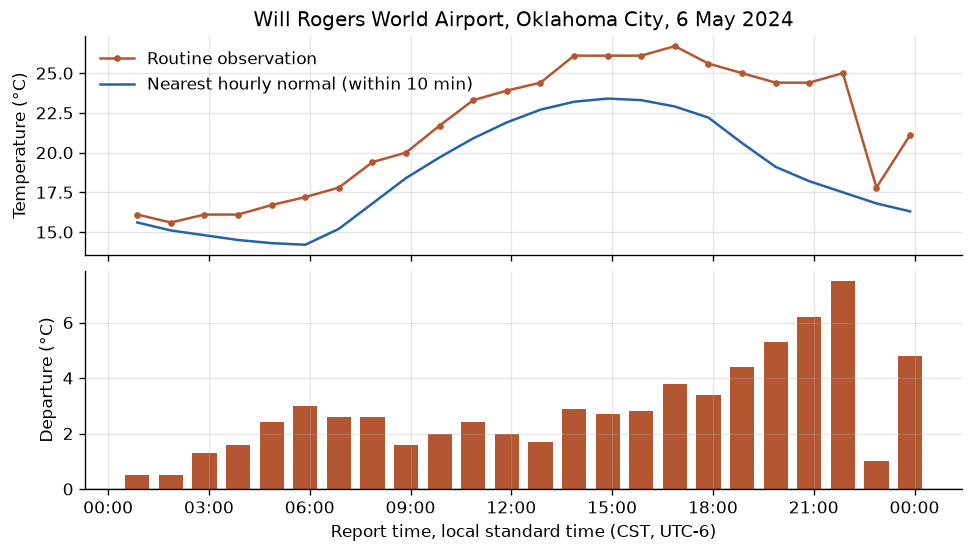
Compare routine airport temperatures with 1991–2020 hourly normals in local standard time, make the matching tolerance explicit, and restore both pinned inputs into an empty cache.
Hourly airport observations · 30-year station climate normals
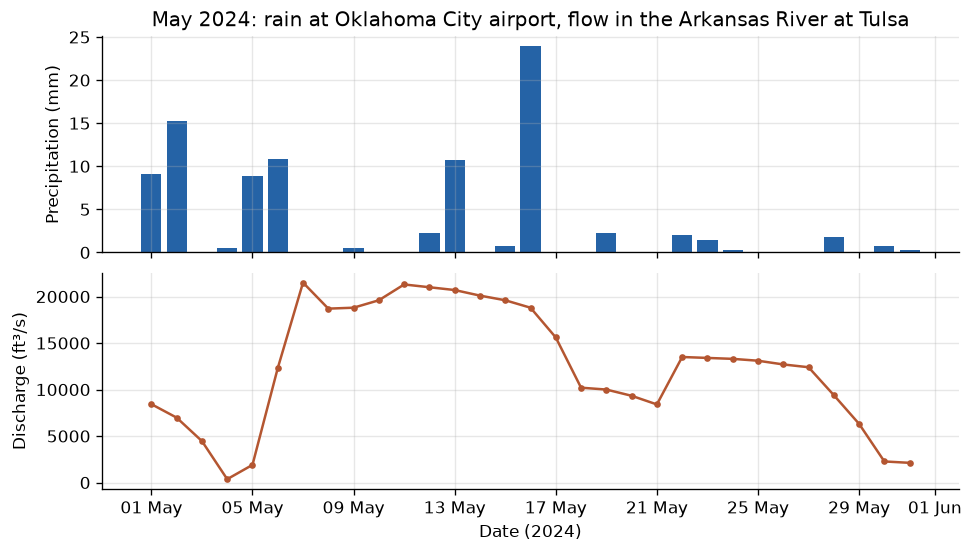
Fetch NOAA and USGS observations with one manifest, inspect the tables, and verify and restore the exact inputs.
Daily station weather · Daily water observations
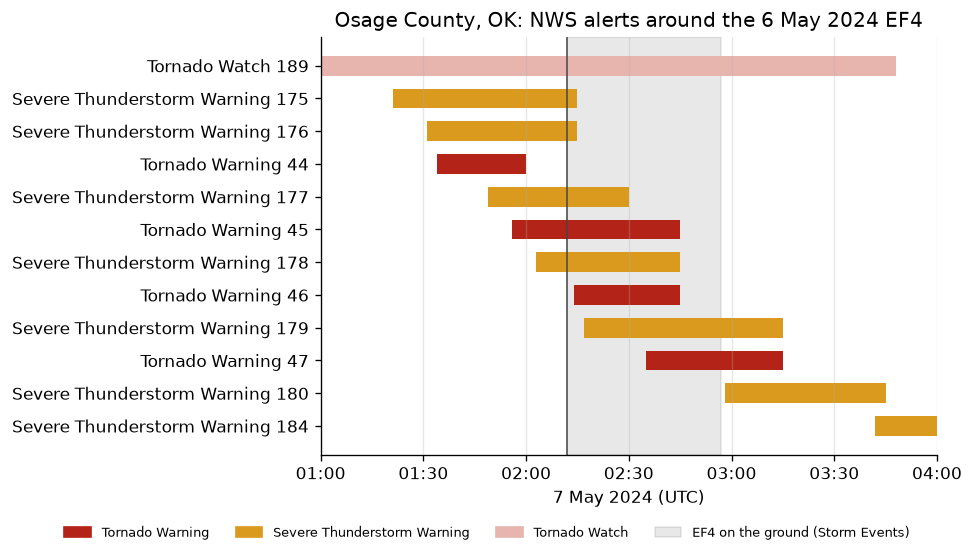
Pin the NWS watches and warnings issued for one county that evening beside the Storm Events report of its EF4, find the warning in effect when the tornado began, and see what a county-level record can and cannot say about lead time.
Storm Events details, fatalities, and locations · NWS warnings and watches by county
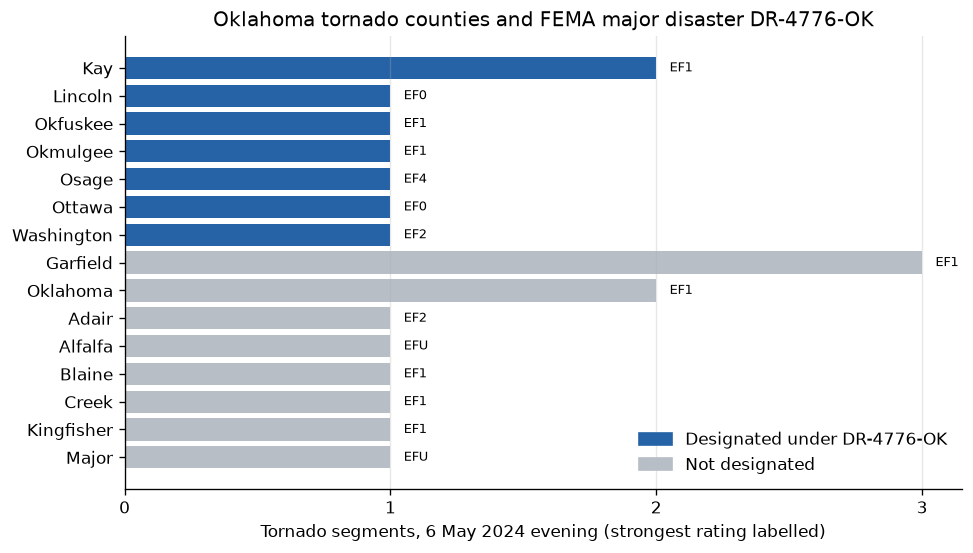
Pin FEMA's major disaster declarations in force in Oklahoma that day and the Storm Events tornado reports, then join them by state and county FIPS code to see which tornado counties were designated.
Storm Events details, fatalities, and locations · Federal disaster declarations by county
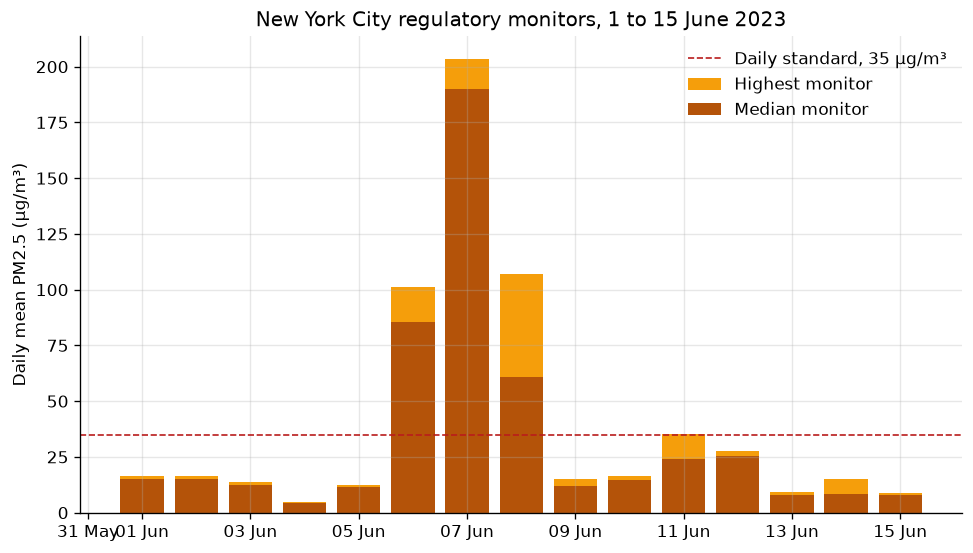
Pin two weeks of EPA AQS daily PM2.5 summaries for the city's regulatory monitors, choose one row per monitor-day from the several AQS writes, and count the monitor-days above 35 ug/m3.
Daily air pollutant summaries from regulatory monitors
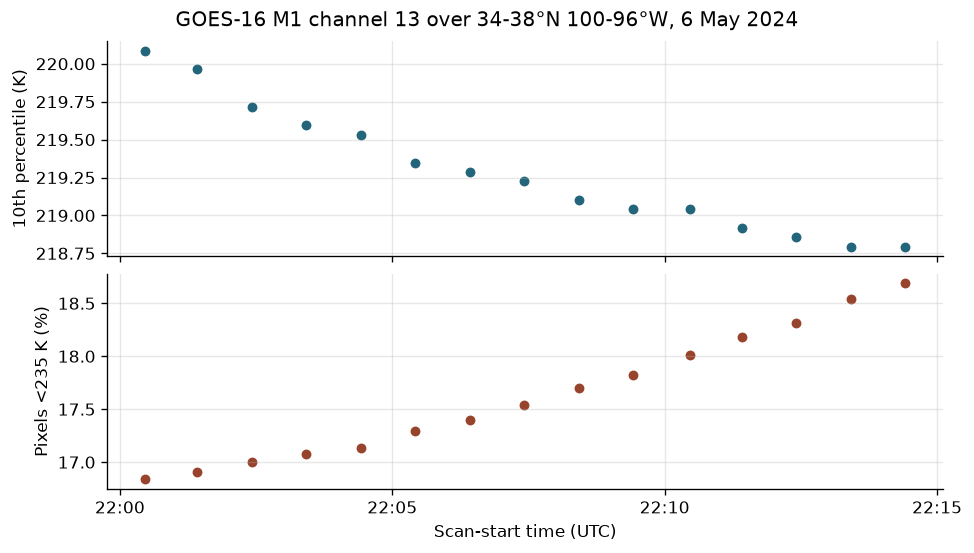
Compare fifteen minutes of GOES-16 M1 channel-13 imagery over a fixed region, report timing and quality gaps, and restore every pinned scene into an empty cache.
GOES CONUS and mesoscale imagery
Run a study yourself
Download a notebook and its dataset.yaml from its page into one folder, then
install usdata with the extras the notebook imports, plus Jupyter and
matplotlib, in a Python 3.11+ environment:
python -m pip install "usdata[pandas]" jupyterlab matplotlib
jupyter lab
Radar walkthroughs need usdata[radar], satellite ones usdata[netcdf],
model-output and MRMS ones usdata[grib], and the rest usdata[pandas]; the
dataset page names the extra. The first run downloads from the agency; later runs use the local
cache. A notebook that needs a key says which environment variables to set.
With a committed lockfile beside the manifest, usdata pull restores exactly
the pinned files instead of asking the agency again.
 usdata